SPEDAS Screenshots: Difference between revisions
Jump to navigation
Jump to search
(Created page with "== SPEDAS Graphical User Interface (GUI) == <gallery mode="traditional"> Image:main_window1.png|Empty SPEDAS GUI|alt=Empty SPEDAS GUI Image:spedas_plots.png|SPEDAS spectrogram...") |
No edit summary |
||
| (3 intermediate revisions by one other user not shown) | |||
| Line 4: | Line 4: | ||
Image:spedas_plots.png|SPEDAS spectrogram, line plots|alt=SPEDAS spectrogram, line plots | Image:spedas_plots.png|SPEDAS spectrogram, line plots|alt=SPEDAS spectrogram, line plots | ||
Image:gui_goes_overview_plot.png|GOES overview plot|alt=GOES overview plot | Image:gui_goes_overview_plot.png|GOES overview plot|alt=GOES overview plot | ||
Image:Overview_plot_themis_gui.png|THEMIS overview plot|alt=THEMIS overview plot | |||
</gallery> | </gallery> | ||
== Loading Data with SPEDAS == | == Loading Data with SPEDAS == | ||
<gallery mode="traditional"> | <gallery mode="traditional"> | ||
Image:Load | Image:Load data.png|Load data from THEMIS|alt=Load data from THEMIS | ||
Image:Load_themis_spectra.png|THEMIS particle spectra|alt=Load particle spectra from THEMIS | Image:Load_themis_spectra.png|THEMIS particle spectra|alt=Load particle spectra from THEMIS | ||
Image:Load_goes_data.png|GOES data|alt=Load GOES data | Image:Load_goes_data.png|GOES data|alt=Load GOES data | ||
| Line 29: | Line 30: | ||
Image:legend_options.png|Legend options|alt=Legend options | Image:legend_options.png|Legend options|alt=Legend options | ||
Image:Xaxis_options.png|X-axis options|alt=X-axis options | Image:Xaxis_options.png|X-axis options|alt=X-axis options | ||
Image:yaxis_options_labels.png|Y-axis options|alt=Y-axis options | |||
Image:zaxis_options_settings.png|Z-axis options|alt=Z-axis options | Image:zaxis_options_settings.png|Z-axis options|alt=Z-axis options | ||
</gallery> | </gallery> | ||
| Line 50: | Line 52: | ||
</gallery> | </gallery> | ||
== | == Overview Plots == | ||
<gallery mode="traditional"> | <gallery mode="traditional"> | ||
Image:overview_plot_themis.png|THEMIS overview plots|alt=THEMIS overview plots | Image:overview_plot_themis.png|THEMIS overview plots|alt=THEMIS overview plots | ||
Image:overview_plot_goes.png|GOES overview plots|alt=GOES overview plots | Image:overview_plot_goes.png|GOES overview plots|alt=GOES overview plots | ||
</gallery> | </gallery> | ||
Latest revision as of 02:09, 18 January 2018
SPEDAS Graphical User Interface (GUI)
-
Empty SPEDAS GUI
-
SPEDAS spectrogram, line plots
-
GOES overview plot
-
THEMIS overview plot
Loading Data with SPEDAS
-
Load data from THEMIS
-
THEMIS particle spectra
-
GOES data
-
WIND data
-
ACE data
-
FAST data
-
IUGONET data
-
OMNI data
-
Geomagnetic indices data
-
CDAWeb data
Plot Options
-
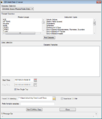
Create plots
-
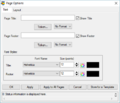
Page text options
-
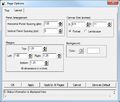
Page layout options
-
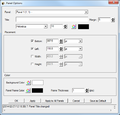
Panel options
-
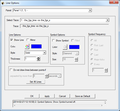
Line options
-
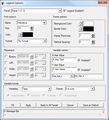
Legend options
-
X-axis options
-
Y-axis options
-
Z-axis options
Analysis and Data Processing
-
Calculate
-
Data processing
-
Magnetic field models
-
Power spectra
-
Wavelet transforms
-
High-pass filters
-
Interpolation
-
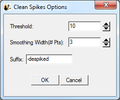
Despike data
-
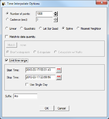
Time derivative
-
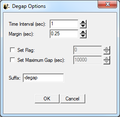
Degap data
-
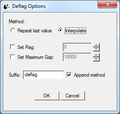
Deflag data
-
Clip data
-
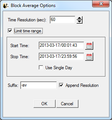
Block averages
-
Nudge traces
Overview Plots
-
THEMIS overview plots
-
GOES overview plots


