Plot Menu - SPEDAS GUI: Difference between revisions
| Line 247: | Line 247: | ||
'''Annotations Tab''' | '''Annotations Tab''' | ||
[[File:3.6. | [[File:3.6.9c.png|||center|Z Axis Options: Annotations]] | ||
The annotations tab allows the user to set the same parameters as Labels with the exception of entering text and setting annotation margins. Annotation precision, by default, will be calculated automatically. The user can specify numerical or exponential format by clicking in the radio buttons directly below the annotation. | The annotations tab allows the user to set the same parameters as Labels with the exception of entering text and setting annotation margins. Annotation precision, by default, will be calculated automatically. The user can specify numerical or exponential format by clicking in the radio buttons directly below the annotation. | ||
Revision as of 15:32, 9 May 2018
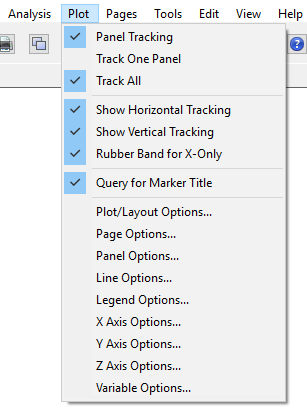
The Graph menu contains selections that are related to manipulating plot properties. The figure on the right shows the options in the Graph pull down menu.
Panel Tracking
Tracking can be toggled on or off by selecting the Panel Tracking option under the Graph menu. When tracking is on, you will see a vertical bar tracking any cursor movement that occurs inside the frame of a panel. By turning off tracking, you also turn off the position legend box in the upper right corners of the panels. This menu item will also turn off the Track One Panel and Track All options.
Track One Panel
The user can choose to turn the vertical tracking line to track only one panel at a time versus all panels. When this mode is selected the vertical tracking bar will track only the panel that the cursor is in. If the position legend is on, only the legend box of the panel the cursor is in will be updated. The Track One/Track All menu pairs are mutually exclusive so when one mode is on, the other will be turned off.
Track All
When in track all mode, the vertical line will track the cursor movement in all panels in the ‘active’ page. See Section "#Track One Panel" to see how the two menu items are paired.
Plot/Layout Options
The Plot/Layout Options window allows the user to create panels and select data values for display on those panels. Panels can be added, deleted, and reordered. Settings associated with panels and traces can be modified as well.
The left hand side of the window is used for selecting the variables to be used in plots. The right hand side of the window is for manipulating panels. If no data has been loaded or panels created both these text areas will be blank. The Variable section at the bottom of the window allows the user to select variables for display below the X axis of the selected panel.
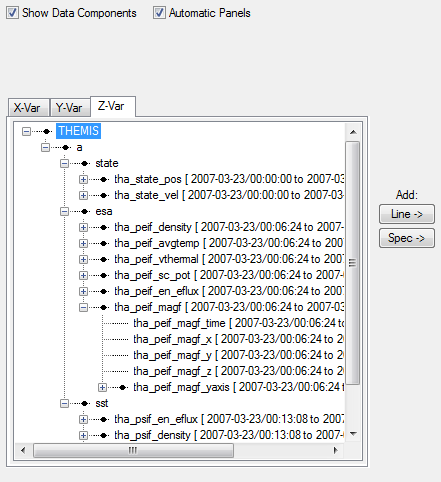
There are two types of plots supported: Linear and Spectral. To add a plot of a particular type, select the data that you want to add and select the line or spectra button. If you check "Show Data Components", you can select the data used to generate the x,y, & z(spectra-only) axes of the plots. The following figure shows examples of both.
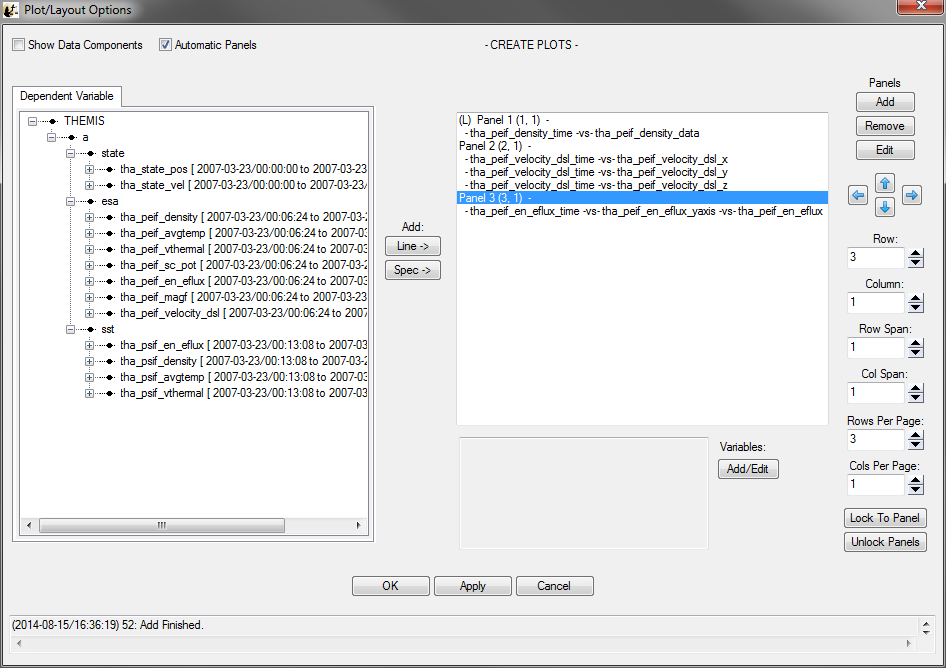
A new panel will automatically be created with the selected variable(s) when the “Line->” or “Spec->” buttons are pressed unless the selected panel is blank. To disable this feature uncheck the Automatic Panels box on the upper left.
As new panels are added the panel number will increase sequentially, regardless of whether earlier panels were deleted or reordered. The row and column numbers are displayed in parenthesis next to the panel number. It is important to note that Panel numbers do not change, however, row and column values can
The user can choose to delete a panel or trace by selecting (or highlighting) the item in the panel text box and clicking delete. Further, the user can modify panel or trace settings by selecting the item and clicking the Edit button. See Sections #Line Options and #Panel Options for additional details.
The Up and Down arrow buttons provide a way to reorder panel rows or trace location on the panel. The left and right arrow buttons move panels by column. Panels can be overlaid, in other words, they can have the same row and column number. The user needs to be aware of this feature when reordering so that care can be taken to ensure the correct layout is created.
The row and column number of a panel can be changed using the Row and Column spinner widgets below the arrow buttons. The total number of rows and columns per page can also be modified. Please note that the total number of page rows and/or columns cannot be set to a value less than the largest row and/or column value (e.g. Panel 4(5, 2) – Panel 4 is displayed in row 5, the user cannot change the total rows to any value smaller than 5, likewise, in this example, total page columns must be greater than or equal to 2).
The X axis of all panels on a page can be locked to that of a particular panel. To do this, select the panel you wish to lock to and click the Lock to Panel button in the bottom right corner of the window. The panel that all others are locked to will have an ‘(L)’ preceding the panel name. When locked the x-axis annotations are only displayed on the last or bottom panel.
When you remove a panel with locked axis and you have more than two panels, the space the removed panel occupied is drawn blank, rather than moving the panels below it. This behavior is by design, and the reason is that in some situations moving the other panels automatically would not be what the user wants, or it might not be obvious how to do it, for example in two-column situations.
The default mode for this window is that the x-axis is time and the y-axis data. The user can choose to show all data components by clicking the Show Data Components check box at the top of the window. When checked, a new tab for the X-axis data will be displayed. In this mode the user can specifically select any x and y data values that have been loaded. You must remember to return to the Y-axis tab and make a selection before clicking the Add button. The following figure shows the Layout Options window in the Show Data Components mode.
At any time the user can click the Apply button to view the panel layout, the OK button to commit the layout, and close the window, or Cancel to undo changes and close the window.
At the bottom of the Layout Panel is a variable section. The text box will display any variables that have been chosen for display below the x-axis. The user can also click the Add/Edit button to bring up the Variable Options window. See Section #Variable Options for details on creating variables for display.
Line Options
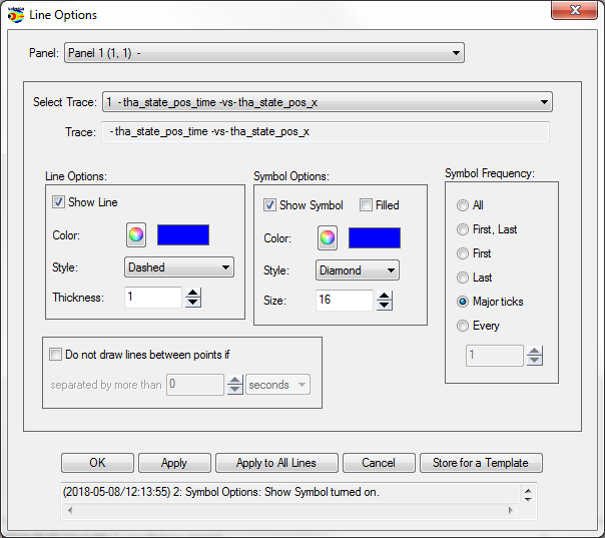
When a trace (or line) is highlighted in the panel window and the Edit button clicked the Line Options window will be opened. The Line Options window allows the user to modify any settings that are associated with plotting the line. The Edit button is for traces only and will not open if a panel is selected.
Line Options can also be opened from the Graph pull down menu.
At the top of the window the user can change the panel and x and y-axes, the window will default to whatever the user selected in the Plot/Layout Options window. Once a trace is selected each widget will be updated to show the current settings for that trace. Line and symbol settings, as well as symbol frequency can be modified on this window. The following figure shows the Line Options window.
Line Modifications
- Show Line: The show check box determines whether the line is displayed or not. A check indicates the line will be drawn.
- Mirror: The mirror check box will draw a horizontal line at zero and reflect the trace below.
- Color: The color button will open the color palette allowing the user to select a different color. When a new color has been accepted the current color swatch next to the button will be updated to reflect the change. If the Apply or OK buttons are clicked the trace will be drawn in the new color.
- Style: The line style drop list contains all the line styles that IDL allows (e.g. dashed, dotted, etc..).
- Thickness: The thickness spinner widget lets the user change to size of the line.
Symbol Modifications
- Show: The show check box will determine whether the symbol is displayed in the plot, or not. A checked box indicates the symbol will be drawn.
- Fill: Fill has not yet been implemented, however, when checked the symbol will be filled in with the selected color.
- Style: The symbol style drop list lets the user choose any of the symbols that IDL allows.
- Color: The color button will open the color palette allowing the user to select a different color. When a new color has been accepted the current color swatch next to the button will be updated to reflect the change. If the Apply or OK buttons are clicked the symbol will be drawn in the new color.
- Size: The size spinner allows the user to increase or decrease the display size of the symbol.
- Symbol frequency has five options for determining when a symbol is drawn and include: First Point, First and Last Point, Last Point, Major Ticks, or Every x points. If the Every x points button is clicked a numeric value can be specified in the spinner widget (e.g. a value of 20 will plot a symbol every 20th point).
As with all graph options windows, the user can click the OK, Apply, or Cancel at any time. Selecting Store for a Template will save the settings for the currently selected trace, so that they can then be saved to a template file. See Section File_Menu_-_SPEDAS_GUI#Template for information on saving templates.
Page Options
The Page Options window controls settings global to the current page. To open this window Select Page Options in the Graph pull down menu.
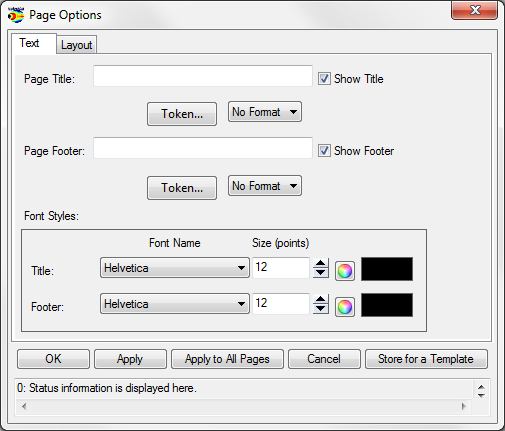
The Text tab (shown below) lets the user choose the settings for size, font, and color of the title, variables, and footer. The ‘Token...’ buttons let the user insert a time stamp with a variety of formats into the title/footer (note that the GUI inserts the token at the current location of the cursor). The ‘Format...’ buttons change boldface and italic settings. The Font Style frame controls font, font size, and font color (a color dialog box opens) for both title and footer. Use the Show check boxes to hide or show the title and footer. The “Apply to All Pages” button will apply the settings to all the available pages.
The Layout tab (shown below) has four active frames: Panel Arrangement, Margins, Canvas Size, and Background. Panel Arrangement: The horizontal and vertical panel spacing sets the horizontal and vertical distance between columns and rows (respectively) of the panels. Margins: The top, left, right, and bottom margins set the distance (in inches) from the corresponding edge of the canvas to the nearest panel. The margins must be at least 0.1 inches. Canvas size: The dimensions of the page in inches.
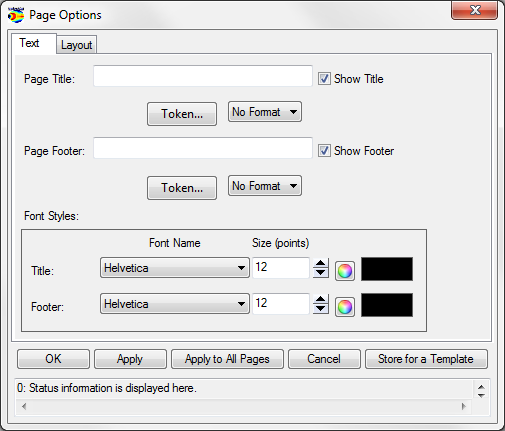
Note: Selecting Store for a Template will save the settings for the page, so that they can then be saved to a template file. See Section File_Menu_-_SPEDAS_GUI#Template for information on saving templates.
Panel Options
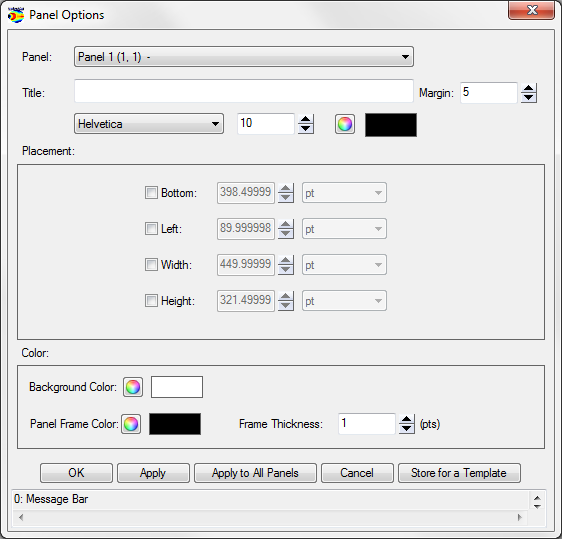
The Panel Options window allows the user to modify the layout, spacing, and color of the panel.
There are four ways in which the row and column configuration can be modified. The row and column spinner widgets allow the user to specify the row/column they want the selected panel to be drawn on. The row and column span determine how many rows or columns the user wishes the panel to for.
Properties associated with the panel frame, color, and thickness as well as back ground color can also be controlled here. If you wish to apply your modifications to all panels on the current page you can check the Set All Panels box. At any time the OK, Apply, or Cancel button can be clicked to commit, view, or undo the changes. The following figure shows the Panel Options window tab.
Note: Selecting Store for a Template will save the settings for the currently selected panel, so that they can then be saved to a template file. See Section File_Menu_-_SPEDAS_GUI#Template for information on saving templates.
X/Y Axis Options
The X-Axis Options window controls the x-axis settings for the selected panel (use the panel drop down menu at the top of the window to change the selection). To get X-Axis Options, select it from the Graph pull down menu. Accepting and canceling changes: Clicking OK accepts the changes and refreshes the page. Clicking Apply accepts the changes provisionally and refreshes the page. Clicking Cancel rejects any changes and refreshes the page. Dismissing the window via the operating system (‘X’ button) has the same effect as clicking Cancel.
Range Tab
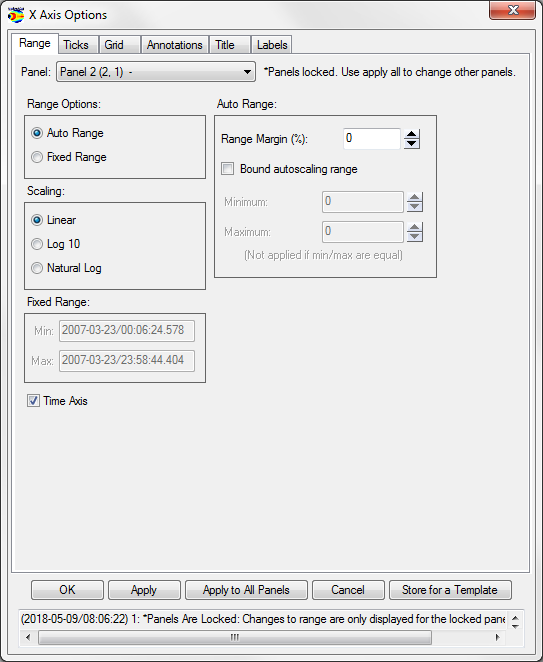
The Range tab sets how the GUI determines the displayed range and gives a special option for when the axis displays time. If the axis is time, then the ‘Is Time’ check box can be set to “Is Time” to generate date & time based annotations on the aixs. Some of the other numerical entry fields will be changed to date entry fields where appropriate.
- Set All Panels: This button works individually for each tab. Any operations done on a given tab after setting the button will propagate to all panels. Behavior with Locked X-Axes on the X-Axis only: When Locked X-Axes in Plot/Layout Options is checked [the default], the GUI will check Set All Panels for the Range, Ticks, and Grid tabs, while unchecking Set All Panels for the Annotation and Labels tabs. We recommend that the user keeps these settings for the Annotation and Labels tabs when axes are locked.
- Auto Range: The range margin sets a margin between the plotted data and the plot box edge (above and below) as a percentage of the maximum minus the minimum of the displayed data. The bound auto-scaling range puts absolute limits on how big the range can get; auto-ranges fully within the bounds are unaffected.
- Floating Center: The GUI determines the center as a mean, or median of the data (the approximate mean/median options currently function identically to the mean/median options.). If the axis uses linear scaling then floating range is calculated using the following equations.
Minimum Range = center – span, Maximum Range = center + span
If the axis uses logarithmic scaling then the floating range is calculated using the following equations:
Minimum Range = base ^ (log(center) – span), Maximum Range = base ^ (log(center) + span)
In other words, the span of the floating center on a logarithmic plot is the number of orders of magnitude above and below the center that should be included in the plot. In the equation above 'base' is either e or 10, and 'log' is either the natural logarithm or the base 10 logarithm, depending upon the type of log scaling that is used. If the axis is Fixed Min/Max: The user determines an absolute range.
- Scaling: The user can select linear, logarithmic base 10, or natural logarithmic scaling.
Ticks Tab
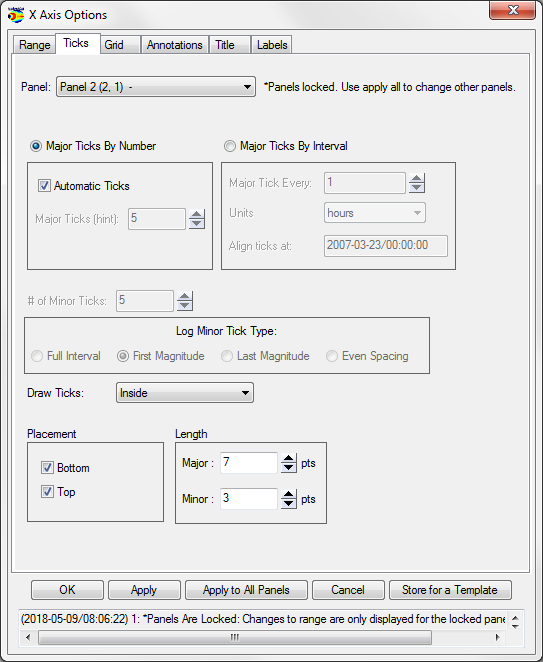
The Ticks tab sets where and how to draw the axis ticks, and contains two frames for Placement and Length The user can choose to manipulate ticks by number, or by interval. When the ‘Major Ticks by Number’ radio button is on, the user can modify the number of ticks in the spinner. By default, the GUI determines ticks automatically; however, the user can toggle this feature on or off. Please note that when Aesthetic Ticks are on, the # of minor ticks will have no effect. Alternately, the user can elect to manipulate ticks by interval. When the ‘Major Ticks by Interval’ button is on, the user can enter the number, the units, and/or the specific time at which to align ticks. If the axis is time, ‘Units’ sets the tick frequency in common time units, otherwise the units widget is not active. The ‘Draw Ticks’ drop list provides for different tick style’s and includes drawing the tick inside the panel frame, outside the panel frame, or both. The Placement frame has right and left buttons that switch ticks on/off for the right and left y-axes of the plot box. The Length frame controls the lengths of the major and minor axes.
Tick options will be measured in orders of magnitude of data units if the axis is logarithmically scaled and data units if the axis is linearly scaled.
Here are some examples that explain how these options work:
- If the axis has linear scaling, the minimum range of the axis is 50, the maximum range of the axis is 100, the 'Major Tick Every' is 10, major ticks will be placed at 55, 65,75,85, and 95.
- If the range of the axis is from 10^1 to 10^6, the axis has base 10 logarithmic scaling and 'Major Tick Every' = 2. Then major ticks will be placed at 10^2,10^4 and 10^6.
NOTE: When auto-ticks are chosen the number of ticks is an upper bound. The actual number of ticks will be determined based on the range of the data.
There is also an option to select the style of logarithmic minor ticks.(Log Minor Tick Type) :
- Full Interval will generate a logarithmic spaced set of minor ticks that cover the entire distance between major ticks even if they have greater than one order of magnitude spacing or non-integer number of order of magnitude spacing. If this setting is used, the selected values for the minor ticks may not correspond to obvious values.
- First Magnitude will generate a logarithmic spaced set of minor ticks that will start at the lower major tick and count upward one order of magnitude. This may mean that there will not be minor ticks for the full interval, or that they may seem compressed, but they will fall at obvious values. For example, if major ticks are at 1 and 100, and there are 8 minor ticks, then minor ticks will be placed at 2,3,4,5,6,7,8,9
- Last Magnitude will generate a logarithmic spaced set of minor ticks that will start at the higher major tick and count downward one order of magnitude. This may mean that there will not be minor ticks for the full interval, or that they may seem compressed, but they will fall at obvious values. For example, if major ticks are at 1 and 100, and there are 8 minor ticks, then minor ticks will be placed at 20,30,40,50,60,70,80,90
- Even Spacing will spaced ticks evenly. For example, if major ticks are at 1 and 100, and there are 9 minor ticks, then minor ticks will be placed at 10^.2,10^.4,10^.6,10^.8,10^1,10^1.2,10^1.4,10^1.6,10^1.8
Grid Tab
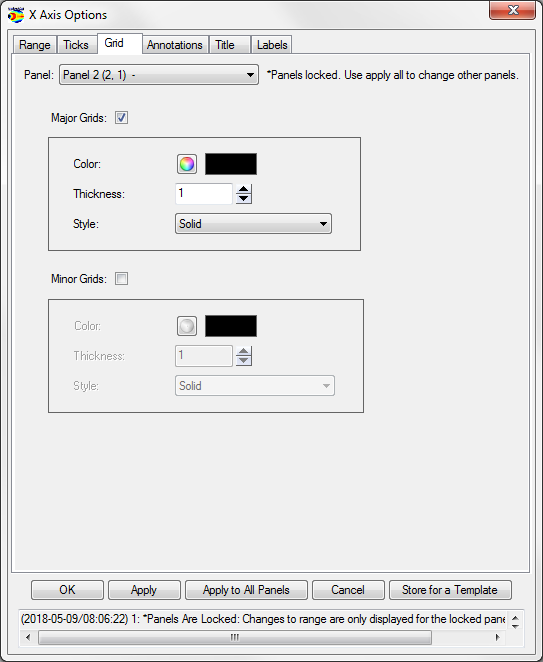
The Grid tab has two frames to implement Major and Minor Grids (color, thickness, and style).
Annotation Tab
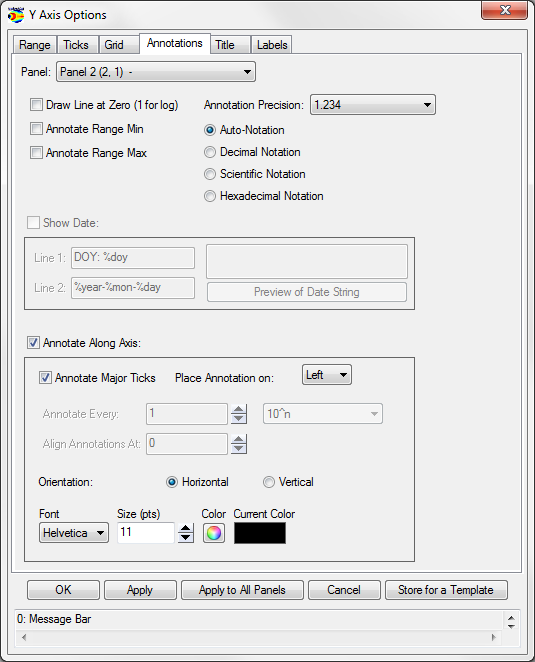
The Annotation tab allows control over annotation settings for the major ticks. This tab can also draw a single line at axis zero, or at 1 for logarithmic scaling (checkbox). The user can also choose to annotate the first and/or the last tick (‘Annotate first’/’Annotate last’). (Note that the first/last tick often coincides with the edges of the plot box.) Check ‘Annotate Along Axis’ to control the placement (top or bottom x-axis), frequency, orientation, font, font size, and color of the annotations. Other annotation options include where to place the annotations, orientation, font type, size and color.

Annotation options for numerical data include auto formatting, decimal notation, and scientific. Auto format will determine if the number can be displayed in decimal format with the selected number of significant figures (Annotation Precision dropdown). If not, then the number will be printed in scientific notation. When forcing to decimal notation the Annotation Precision dropdown will designate the number of places printed after the decimal, not significant figures. Trailing zeros are automatically clipped by the software (i.e. “10.00000” is printed as “10”).
Title Tab
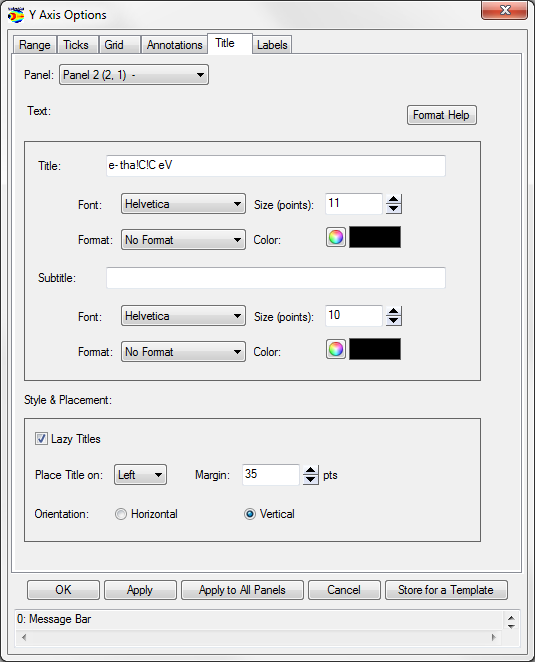
The Title tab controls whether the panel titles and subtitles are shown. The Lazy Titles option will insert carriage returns (new lines) in place of any underscores in the title text. Margin, font, format, font size, and color (for individual labels) can be changed.
Labels Tab
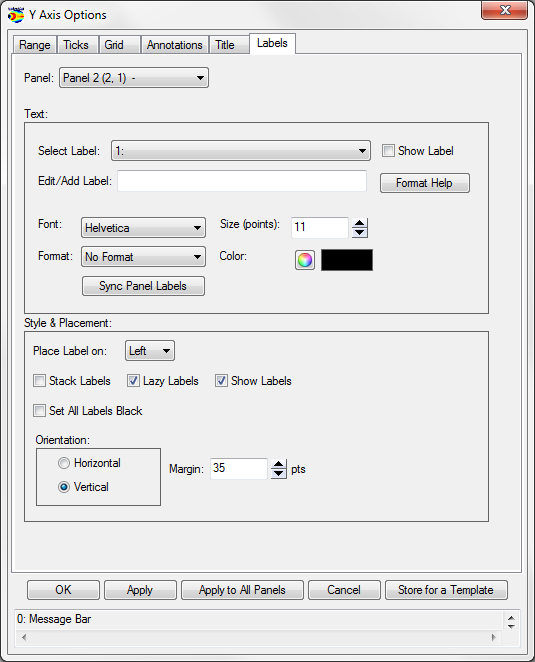
The Labels tab controls whether the labels are shown and/or stacked. Check both ‘Show Labels’ and ‘Show Label’ to display a label. The Lazy Labels option will insert carriage returns (new lines) in place of any underscores in the label text. The orientation and margin, font, format, font size, and color (for individual labels) can be changed. Options may be set globally within the current page with the Set All Panels box (label color and text are excluded).
The Y-Axis Options window has an additional feature that the X-Axis Options does not. The user can choose to set all Labels to black. By default the line color and label color are synced on the y axis, the Set All Labels Black allows the user to override the default colors. This can be useful in printing publication plots.
Note: Selecting Store for a Template will save the settings for the currently selected panel, so that they can then be saved to a template file. See Section File_Menu_-_SPEDAS_GUI#Template for information on saving templates.
Z Axis Options
The TDAS GUI allows graphing of three-dimensional spectral quantities from the spacecraft as well as ground-based keograms. See the Section #Plot/Layout Options for details on graphing spectra.
Once spectral plots are created their extra display features and parameters can be edited in the Z Axis Options found under the Graph pull down menu in the main window. Options for the X and Y-axes are still functional and can also be found under the Graph pull down menu.
Settings Tab
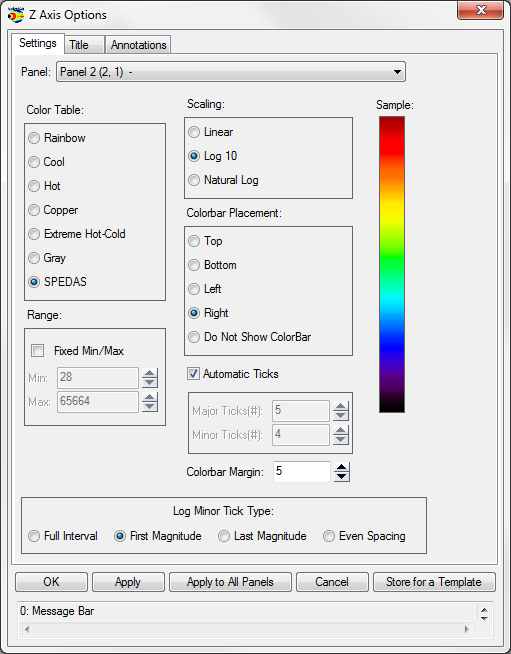
The Settings tab contains display and annotation options. The Panels drop list contains all plots in the active page that have z-axes.
- Color Table: The color table section allows the user to change the color scheme being mapped to z-axis values on the active panel. A preview of the current selection can be seen on the right. The color bar represents numerical values in decreasing order from top to bottom. Colors are mapped to numerical values according to the chosen Scaling.
- Scaling: Determines how the selected Color Table is mapped to z-axis values. Values within the range are assigned linearly by default but can be assigned according to a base-ten or natural logarithmic scale.
- Colorbar Placement: Sets the position of the Color Bar. The Color Bar displays the color scheme of the associated panel plus numeric annotations for scaling.
- Number Ticks: The number of “ticks” (i.e. scaling annotations) that are displayed along the Color Bar. Ticks will only be displayed if the Color Bar is present.
- Colorbar Margin: The distance, in number of pixels, between the plot area and the Color Bar.
- Range: The z-axis range is automatically calculated by default and the color table is mapped with the selected scaling. Checking the Fixed Min/Max box allows the user to specify the maximum and minimum values for the plot. Values above or below the limits are respectively assigned the color corresponding to the maximum or minimum value.
- Log Minor Tick Type: Determines the way that logarithmic minor ticks are spaced on the Z-axis.(See Section 3.6.8: X/Y Axis Options for description of options)
Title Tab
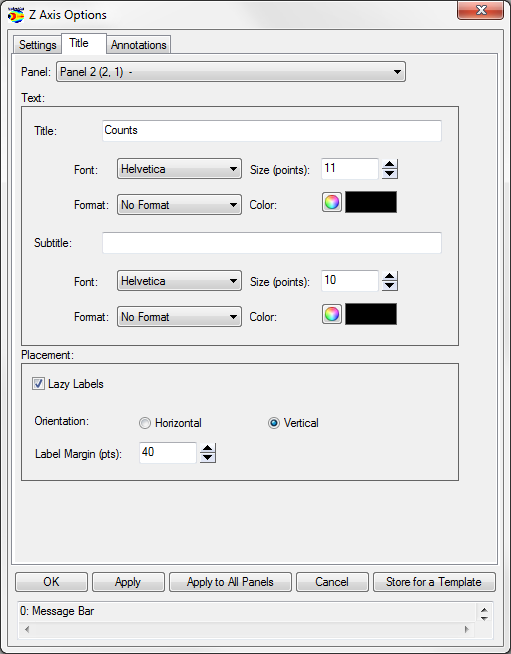
The title tab and the annotations tab contain options for formatting z-axis annotations and adding/formatting z-axis labels. The Panels drop list contains all plots in the active page that have z-axes. IDL style formatting for z axis labels was added in releases after 5.1-1.
- Title: Enter text here to create a label for the Color Bar.
- Subtitle: Enter text here to create a subtitle label for the Color Bar.
- Font: Select the font for the text entered into the Text box to be displayed in.
- Format: Select formatting options for Label text such as bold and italic.
- Size: The font size for the Label text.
- Color: The color button will open the color palette for selecting the color of the Label text.
- Label Margin: The label margin spinner sets the size of the margin before the Label. Margin values are in points.
- Orientation: Labels can be drawn horizontally or vertically.
- Lazy Labels: When checked this options will convert any underscores in the label no carriage returns (new lines)
Annotations Tab
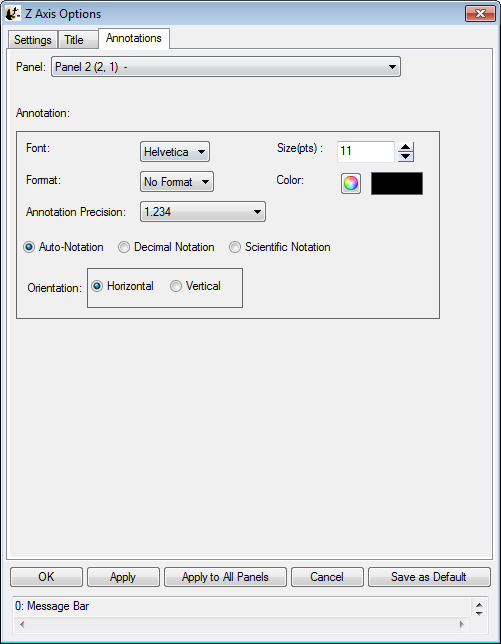
The annotations tab allows the user to set the same parameters as Labels with the exception of entering text and setting annotation margins. Annotation precision, by default, will be calculated automatically. The user can specify numerical or exponential format by clicking in the radio buttons directly below the annotation.
Note: Selecting Store for a Template will save the settings for the currently selected panel, so that they can then be saved to a template file. See Section File_Menu_-_SPEDAS_GUI#Template for information on saving templates.
Variable Options
The Variable Options window lets the user add variables beneath the selected panel. To get Variable Options, select it from the Graph pull down menu. Accepting and canceling changes: Clicking OK accepts the changes and refreshes the page. Clicking Cancel rejects any changes. Dismissing the window via the operating system (‘X’ button) has the same effect as clicking Cancel. The Apply button allows users to view the changes without closing the window. Hitting "Cancel" will undo applied changes. The following figure shows an example of the Variable Options window.
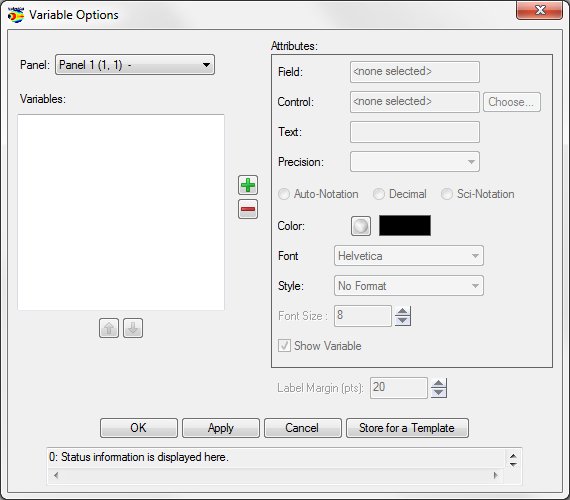
The Attributes frame: The Field attribute shows the proper data name of the variable and never changes. The Control attribute shows which data name represents the abscissa for the variable. By default, the GUI sets the control to the time data for the Field. The Text attribute changes the name of the variable as displayed in the Variables frame on the left and on the plotted panel. The Precision attribute sets the format of the variable annotations (time formats for time variables, floating formats for numeric variables). Precision, by default, is calculated automatically, however, the user can choose to override the default settings by selecting either the numerical or exponential radio buttons. The color attributes set the color of the selected variable. The ‘Include units in label’ check box currently has no effect. Use the ‘Show Variable’ check box to show or hide a variable on the plot. Status information on the window operations appears in the status bar at the bottom of the window.
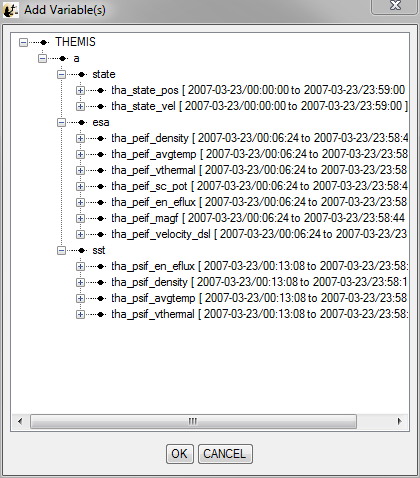
To add variables, click the add button (‘+’). The ‘Add Variable(s)’ dialog appears with a tree view of the loaded data. Select individual data products, or entire branches. Shift-click or ctrl-click to select ranges or elements. Click OK to accept the selections, or Cancel to start over. Any selections now appear in the Variables frame on the left. Click OK to accept and have these variables appear below the current panel, or Cancel to exit Variable Options with no changes. The user may also select a variable (click on it) to change its attributes (see the Attributes frame on the right), to delete it (‘-‘ button), or to change its position in the list (up and down arrows). The Label Margin (below Attributes) changes the margin between all variables (for the selected panel) and the left y-axis of the plot box, and also changes the margin between the variable legend and the right y-axis of the plot box. An example of the Add Variable window is shown below in the following figure.
Note: Selecting Store for a Template will save the settings for the currently selected variable, so that they can then be saved to a template file. See Section File_Menu_-_SPEDAS_GUI#Template for information on saving templates.
A note on locking axes: The GUI hides all variables except those on the last panel when ‘Lock X-Axes’ is checked (see Plot/Layout Options on the Graph pull down menu). This behavior may be modified in later versions.