Tools Menu - SPEDAS GUI: Difference between revisions
No edit summary |
No edit summary |
||
| Line 36: | Line 36: | ||
2. STD method can be used to calculate the velocity of quasi-stationary structures at every observed moment in time from multi-point magnetic field measurements. | 2. STD method can be used to calculate the velocity of quasi-stationary structures at every observed moment in time from multi-point magnetic field measurements. | ||
'''Satellite/Data Selections''' | |||
* Satellite: The check boxes for MMS and THEMIS allows the user to select the satellites they wish to analyze. At least four satellites must be selected. The Cluster mission will be added soon. | |||
* Instrument Type: This pull down menu allows the user to select Magnetic Fields, Electric Fields, or Velocity. | |||
* Data Type: The data type pull down menu allows the user to select the type or resolution of data and is dependent on the satellite and instrument selections. Data type selections will vary per mission. | |||
* Coordinate: Coordinate system selections, like data type, will change according to satellite, instrument, and data type selections. | |||
* Time: This is the standard time frame selection widget used throughout the SPEDAS GUI. Any time the start or stop times are changed the duration spinner will update the value of the duration in seconds to reflect the changes. As an additional option, the user can choose to set the duration of the time frame. Modifying the duration will alter the stop time to reflect the new duration. | |||
* Plot: This button will automatically load a tplot variable and plot the data. It should be noted that data is loaded into a tplot variable and not into a GUI variable. Like all tplot variables, they will persist in memory until the IDL session is closed. If the user chooses to delete them or import them into the GUI, they can do so via the main file pull down menu option 'Manage Data and Import/Export Tplot Variables...' | |||
== Minimum Variance Analysis == | == Minimum Variance Analysis == | ||
Revision as of 19:25, 5 February 2019
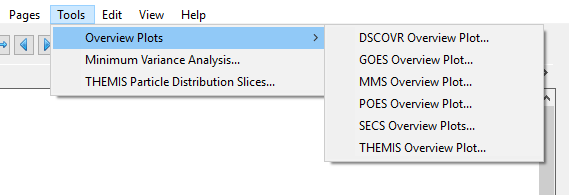
The Tools menu contains mission-specific software tools. The figure on the right shows the options in the Tools pull down menu.
Tools are peripheral GUIs, often mission specific, that interface with SPEDAS through its plugin API. Plugin software can access all data stored in the SPEDAS as well as it's graphical features. This allows for custom analysis and automatic production of customized plots.
GOES Overview Plots
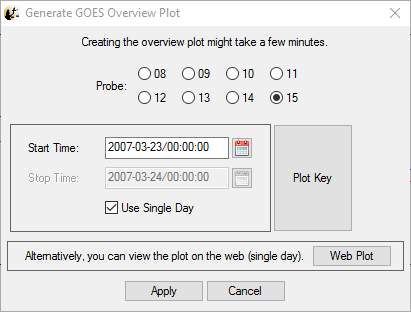
The GOES Overview Plot window will produce overview/summary plots for a particular GOES spacecraft over a specified time window. All data for the summary plot will be loaded into the GUI and the overview plot automatically generated on a new page. Some GEOS data may be overwritten when producing overview plots. Creating a new plot for a particular spacecraft will overwrite all data loaded for previous overview plots for that spacecraft. A URL is also provide to view daily summary plots on the web.
POES Overview Plots
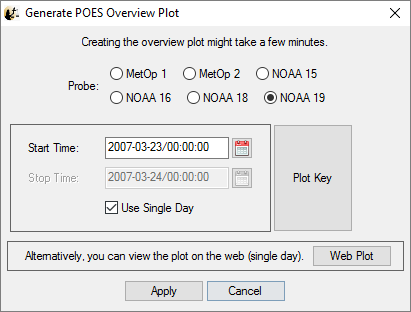
The POES Overview Plot window will produce overview/summary plots for a particular POES spacecraft over a specified time window. All data for the summary plot will be loaded into the GUI and the overview plot automatically generated on a new page. Some POES data may be overwritten when producing overview plots. Creating a new plot for a particular spacecraft will overwrite all data loaded for previous overview plots for that spacecraft. A URL is also provided to view daily summary plots on the web.
THEMIS Overview Plots
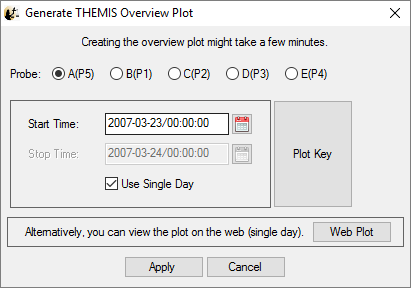
The THEMIS Overview plot window will produce overview/summary plots for a particular THEMIS spacecraft for a specified time window. All data for the overview plot will be loaded into the GUI and a new page containing the overview plot will be generated. Some THEMIS data may be overwritten when producing overview plots. Creating a new plot for a particular spacecraft will overwrite all data loaded for previous overview plots for that spacecraft. A URL is also provided to view daily summary plots on the web.
Minimum Directional Derivative (MDD) and Spatio-Temporal Difference (STD)
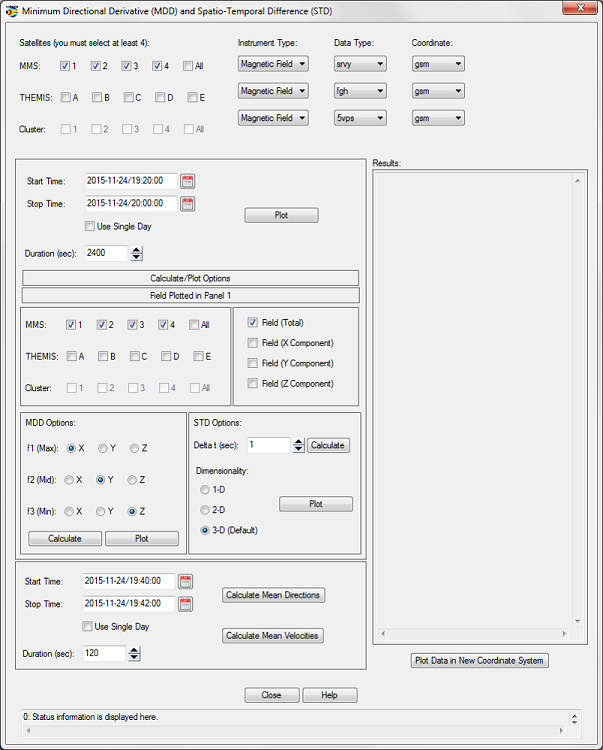
The MDD & STD methods are to determine the structures dimensionality (i.e. whether is is 1-D, 2-D or 3-D), to build a dimensionality based (dim-based) coordinate system and a proper moving frame in space data analysis based on which one can directly compare with simulated and theoretical works.
1. MDD method can be used to analyze the dimensionality character of observed structures using multipoint vector field measurements of four or more spacecraft. A new dim-based coordinate system can be built and the normal of 1-D structure and invariant axis of a 2-D structure can be found instantly at every observed time moment.
2. STD method can be used to calculate the velocity of quasi-stationary structures at every observed moment in time from multi-point magnetic field measurements.
Satellite/Data Selections
- Satellite: The check boxes for MMS and THEMIS allows the user to select the satellites they wish to analyze. At least four satellites must be selected. The Cluster mission will be added soon.
- Instrument Type: This pull down menu allows the user to select Magnetic Fields, Electric Fields, or Velocity.
- Data Type: The data type pull down menu allows the user to select the type or resolution of data and is dependent on the satellite and instrument selections. Data type selections will vary per mission.
- Coordinate: Coordinate system selections, like data type, will change according to satellite, instrument, and data type selections.
- Time: This is the standard time frame selection widget used throughout the SPEDAS GUI. Any time the start or stop times are changed the duration spinner will update the value of the duration in seconds to reflect the changes. As an additional option, the user can choose to set the duration of the time frame. Modifying the duration will alter the stop time to reflect the new duration.
- Plot: This button will automatically load a tplot variable and plot the data. It should be noted that data is loaded into a tplot variable and not into a GUI variable. Like all tplot variables, they will persist in memory until the IDL session is closed. If the user chooses to delete them or import them into the GUI, they can do so via the main file pull down menu option 'Manage Data and Import/Export Tplot Variables...'
Minimum Variance Analysis
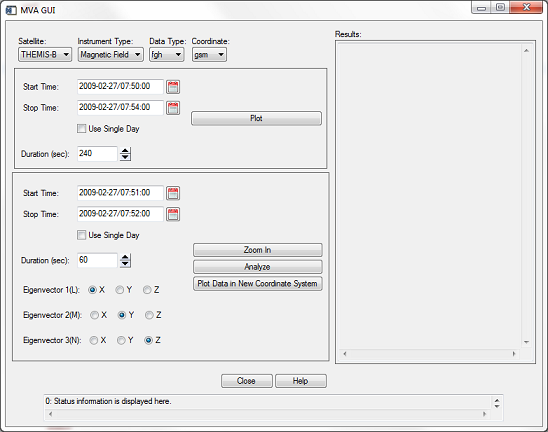
The Minimum Variance Analysis option opens the GUI window shown above. From here the user can perform minimum variance analysis on Magnetic and Electric Fields Data, Particle Data, and Velocity on THEMIS data. MMS and Cluster data is under developement.
Data Selections
- Satellite: The pull down menu allows the user to select the satellite (mission) data they wish to analyze. THEMIS data is available, MMS is under development, and Cluster will be added soon.
- Instrument Type: This pull down menu allows the user to select Magnetic Fields, Electric Fields, Particle Data, or Velocity.
- Data Type: The data type pull down menu allows the user to select the type or resolution of data and is dependent on the satellite and instrument selections. Data types will change if a different satellite or instrument type are selected by the user.
- Coordinate: Coordinate system selections, like data type, will change according to satellite, instrument, and data type selections.
- Time: This is the standard time frame selection widget used throughout the SPEDAS GUI. Any time the start or stop times are changed the duration spinner will update the value of the duration in seconds to reflect the changes. As an additional option, the user can choose to set the duration of the time frame. Modifying the duration will alter the stop time to reflect the new duration.
- Plot: This button will load a tplot variable and plot the data. It should be noted that data is loaded into a tplot variable and not into a GUI variable. Like all tplot variables, they will persist in memory until the IDL session is closed. If the user chooses to delete them or import them into the GUI, they can do so via the main file pull down menu option 'Manage Data and Import/Export Tplot Variables...'
Minimum Variance Selections
- Time: The standard GUI time widget in this section is the time frame that will be used for analysis. It should be noted that if the user changes the time frame in the general selection area above that is outside of this time frame, this time will be changed to reflect the new time.
- Eigenvectors (LMN): These buttons allows the user to set which component of L, M, or N is positive.
- Zoom In: The zoom in button can be used to zoom in on the original data set and works similar to using twindow for tplot variables. The 'Plot' button above must be selected first followed by the 'Zoom In' button. Once the zoom in button is selected the user can then left click on the plot to select the start and stop times. The time widget in this analysis section will be changed to what ever start and stop time the user clicked on the plot.
- Analyze: This button will perform the minimum variance analysis and report the results in the 'Results' text box.
- Plot: The plot data button will plot both the original data and the data in the new coordinate system.
As with other windows, the user can click the close button at any time.
THEMIS Particle Distribution Slices
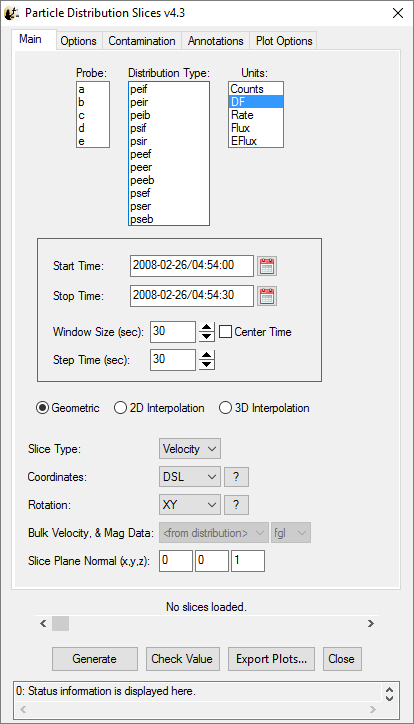
The THEMIS Particle Distribution Slices option opens the GUI windows shown above. From here the user can generate slices of velocity distributions from THEMIS SST and ESA data.