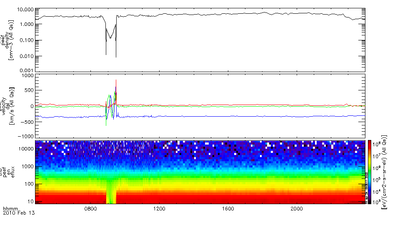
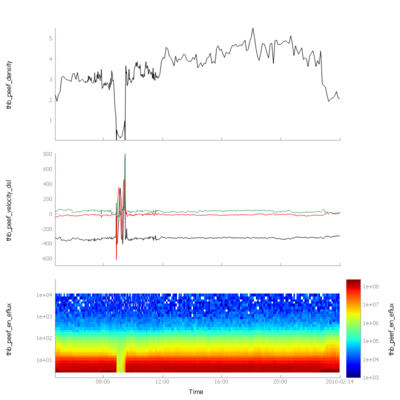
Spectrogram
Compare IDL code to python code.
IDL code: SPEDAS
trange = ['2010-02-13', '2010-02-14']
probe = 'b'
thm_load_esa, probe=probe, trange=trange, datatype='peef_density peef_velocity_dsl peef_en_eflux'
tplot, ['thb_peef_density', 'thb_peef_velocity_dsl', 'thb_peef_en_eflux']
Python code: pySPEDAS
import pyspedas
import pytplot

# Get data
trange = ['2010-02-13', '2010-02-13']
probe = 'b'
var = ['thb_peef_density', 'thb_peef_velocity_dsl', 'thb_peef_en_eflux']
pyspedas.themis.esa(probe=probe, trange=trange, varnames=var)

# Set plot options
pytplot.options(var[1], 'ytitle', var[1])
pytplot.ylim(var[1], -700, 800)
pytplot.options(var[2], 'colormap', 'jet')
pytplot.options(var[2], 'ylog', True)
pytplot.options(var[2], 'zlog', True)
pytplot.options(var[2], 'ytitle', var[2])
pytplot.ylim(var[2], 1.5, 50000.0)

# Plot
pytplot.tplot(var)

