MMS Hot Plasma Composition Analyzer
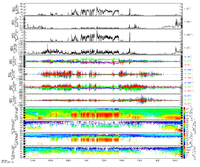
The MMS HPCA measures the distribution of hydrogen, helium, and oxygen ions using an electrostatic analyzer. SPEDAS provides command line and GUI access to HPCA data.
Release notes can be found here:
https://lasp.colorado.edu/galaxy/display/mms/HPCA+Release+Notes
For basic command line access see:
HPCA moments
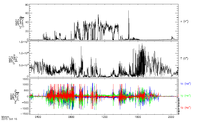
To load and plot HPCA moments for MMS1 on March 7, 2016:
HPCA spectrograms
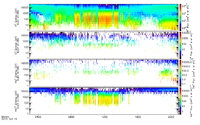
To load and plot HPCA energy spectrograms for MMS1 on March 7, 2016:
SPEDAS derived products
- Main article: MMS derived particle products
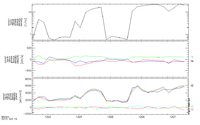
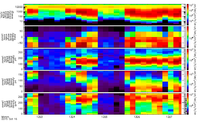
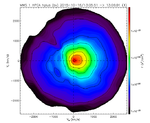
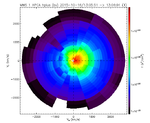
Moments and spectrograms can be calculated from the full 3D distributions using general SPEDAS routines. This allows for various options, such as energy and angle ranges, to be set manually for the calculation.
For example usage see:
Moments
When producing moments all data products are calculated simultaneously for a particular input. Spacecraft potential and magnetic field are specified via supplementary tplot variables.
Specrograms
Angular spectrograms are calculated in spacecraft and field-aligned coordinates. Phi (azimuth) and theta (elevation) spectra are calculated in spacecraft coordinates. Gyrophase (azimuth) and pitch angle (co-lat) spectra are calculated in field-aligned coordinates. Magnetic field and ephemeris data are specified via supplementary tplot variables. Energy spectrograms are also available.
2D slices
- Main article: SPEDAS particle distribution slices
Slices of full 3D particle data can be visualized as smooth contours or by angle/energy bin.
For example usage see:
Visualizing 3D Distribution Functions
- Main article: ISEE_3D
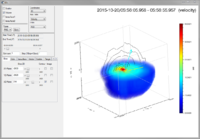
SPEDAS can also be used for visualizing MMS 3D distribution functions from HPCA using the ISEE_3D tool, developed by the Institute for Space-Earth Environmental Research (ISEE), Nagoya University, Japan.
For example usage see:
Example
Load data into tplot
MMS> trange = ['2015-10-20/05:56', '2015-10-20/05:58']
MMS> mms_load_hpca, probe='1', trange=trange, data_rate='srvy', datatype='ion'
Load the data into standard structures
MMS> dist = mms_get_dist('mms1_hpca_hplus_phase_space_density', trange=trange)
MMS> data = spd_dist_to_hash(dist) ;convert structures to isee_3d data model
Load the magnetic field (cyan vector) and velocity (yellow vector) support data
MMS> mms_load_fgm, probe=1, trange=trange, level='l2'
MMS> mms_load_hpca, probe=1, trange=trange, data_rate='srvy', datatype='moments'
Once the GUI is opened, select PSD from Units menu
MMS> isee_3d, data=data, trange=trange, bfield='mms1_fgm_b_gse_srvy_l2_bvec', velocity='mms1_hpca_hplus_ion_bulk_velocity'