Tools Menu - SPEDAS GUI
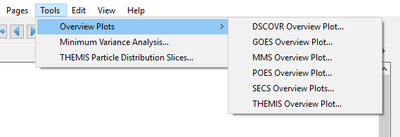
The Tools menu contains mission-specific software tools. The figure on the right shows the options in the Tools pull down menu.
Tools are peripheral GUIs, often mission specific, that interface with SPEDAS through its plugin API. Plugin software can access all data stored in the SPEDAS as well as it's graphical features. This allows for custom analysis and automatic production of customized plots.
GOES Overview Plots
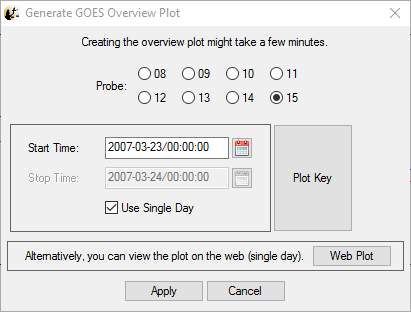
The GOES Overview Plot window will produce overview/summary plots for a particular GOES spacecraft over a specified time window. All data for the summary plot will be loaded into the GUI and the overview plot automatically generated on a new page. Some GEOS data may be overwritten when producing overview plots. Creating a new plot for a particular spacecraft will overwrite all data loaded for previous overview plots for that spacecraft. A URL is also provide to view daily summary plots on the web.
POES Overview Plots
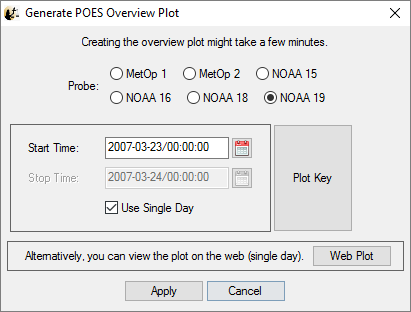
The POES Overview Plot window will produce overview/summary plots for a particular POES spacecraft over a specified time window. All data for the summary plot will be loaded into the GUI and the overview plot automatically generated on a new page. Some POES data may be overwritten when producing overview plots. Creating a new plot for a particular spacecraft will overwrite all data loaded for previous overview plots for that spacecraft. A URL is also provided to view daily summary plots on the web.
THEMIS Overview Plots
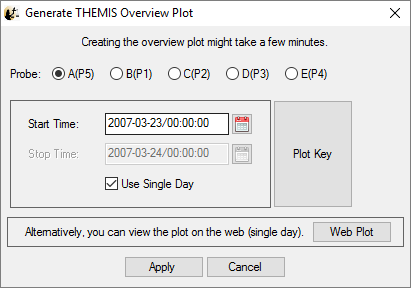
The THEMIS Overview plot window will produce overview/summary plots for a particular THEMIS spacecraft for a specified time window. All data for the overview plot will be loaded into the GUI and a new page containing the overview plot will be generated. Some THEMIS data may be overwritten when producing overview plots. Creating a new plot for a particular spacecraft will overwrite all data loaded for previous overview plots for that spacecraft. A URL is also provided to view daily summary plots on the web.
Minimum Variance Analysis
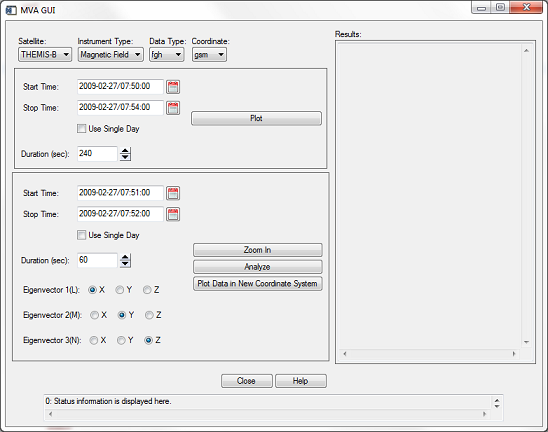
The Minimum Variance Analysis option opens the GUI window shown above. From here the user can perform minimum variance analysis on Magnetic and Electric Fields Data, Particle Data, and Velocity on THEMIS data. MMS and Cluster data is under developement.
THEMIS Particle Distribution Slices
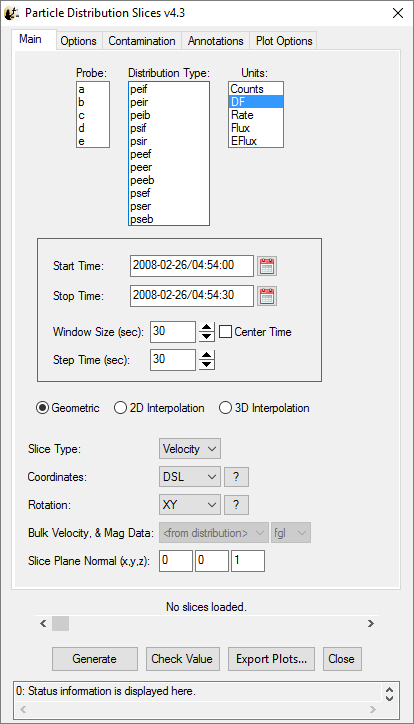
The THEMIS Particle Distribution Slices option opens the GUI windows shown above. From here the user can generate slices of velocity distributions from THEMIS SST and ESA data.