File:Hpca isee 3d.PNG: Difference between revisions
Jump to navigation
Jump to search
(Visualization of 1 spin of HPCA H+ distribution using ISEE_3D. Image shows screenshot of GUI displaying voxel plot for V_z < 0 km/s (DBCS) and a line contour at y=314 km/s. ISEE_3D was developed by the Institute for Space-Earth Environmental Research...) |
(No difference)
|
Latest revision as of 23:21, 27 May 2016
Visualization of 1 spin of HPCA H+ distribution using ISEE_3D. Image shows screenshot of GUI displaying voxel plot for V_z < 0 km/s (DBCS) and a line contour at y=314 km/s.
ISEE_3D was developed by the Institute for Space-Earth Environmental Research (ISEE), Nagoya University, Japan.
File history
Click on a date/time to view the file as it appeared at that time.
| Date/Time | Thumbnail | Dimensions | User | Comment | |
|---|---|---|---|---|---|
| current | 23:21, 27 May 2016 | 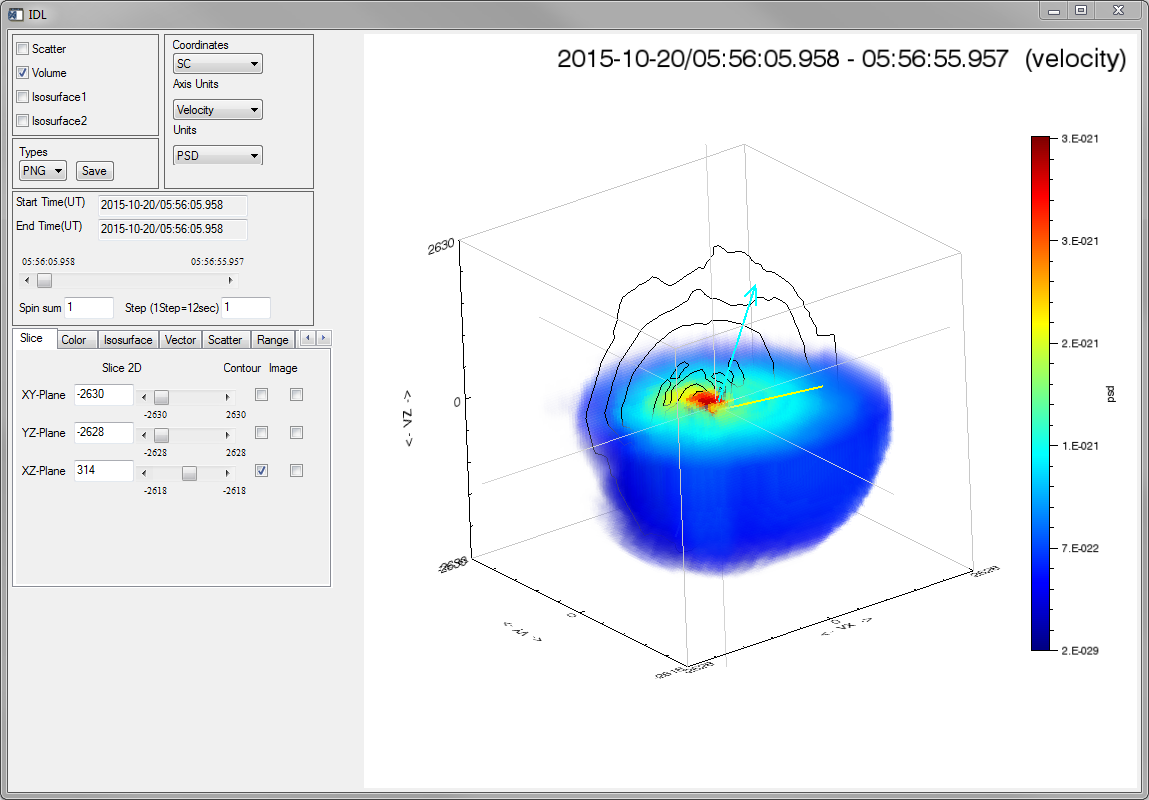 | 1,149 × 800 (204 KB) | Floresaa (talk | contribs) | Visualization of 1 spin of HPCA H+ distribution using ISEE_3D. Image shows screenshot of GUI displaying voxel plot for V_z < 0 km/s (DBCS) and a line contour at y=314 km/s. ISEE_3D was developed by the Institute for Space-Earth Environmental Research... |
You cannot overwrite this file.
File usage
The following page uses this file: