File:Hpca spd spec.png
Jump to navigation
Jump to search
Size of this preview: 800 × 500 pixels.
Original file (960 × 600 pixels, file size: 31 KB, MIME type: image/png)
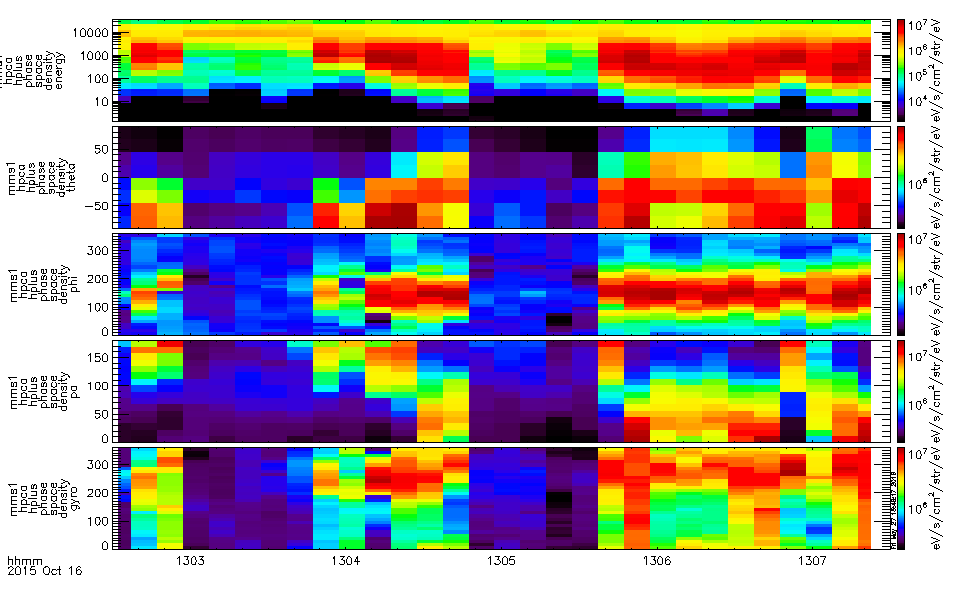
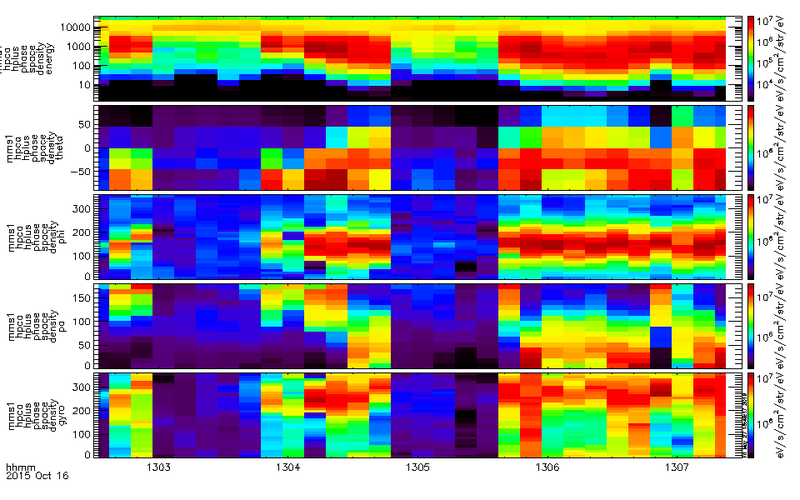
Example of spectrograms calculated from 3D HPCA H+ distributions. Displayed: H+ energy, phi (sc-azimuth), theta (sc-elevation), pitch angle (mag-co-lat), and gyrophase (mag-azimuth).
File history
Click on a date/time to view the file as it appeared at that time.
| Date/Time | Thumbnail | Dimensions | User | Comment | |
|---|---|---|---|---|---|
| current | 23:02, 27 May 2016 | | 960 × 600 (31 KB) | Floresaa (talk | contribs) | Example of spectrograms calculated from 3D HPCA H+ distributions. Displayed: H+ energy, phi (sc-azimuth), theta (sc-elevation), pitch angle (mag-co-lat), and gyrophase (mag-azimuth). |
You cannot overwrite this file.
File usage
The following page uses this file: