GOES: Difference between revisions
No edit summary |
(Updating the div's) |
||
| Line 16: | Line 16: | ||
=== Examples === | === Examples === | ||
==== Fluxgate Magnetometer (FGM) ==== | ==== Fluxgate Magnetometer (FGM) ==== | ||
<div style="border: 1px solid LightGray; background-color:#F9F9F9; padding: 10px;"> | To load and plot the magnetic field measured by the FGM instrument onboard GOES-12 on 3/22/2008: | ||
<div style="border: 1px solid LightGray; background-color:#F9F9F9; padding: 0px 10px; margin-left: 5px; margin-right: 5px;"> | |||
SPEDAS> goes_load_data, trange=['2008-03-22', '2008-03-23'], datatype='fgm', probes='12', /avg_1m | SPEDAS> goes_load_data, trange=['2008-03-22', '2008-03-23'], datatype='fgm', probes='12', /avg_1m | ||
| Line 23: | Line 24: | ||
==== Energetic Particle Sensor (EPS) ==== | ==== Energetic Particle Sensor (EPS) ==== | ||
Load and plot the 1-min averaged 2.4MeV proton flux as measured by the EPS instrument onboard GOES-12 on March 22, 2008: | Load and plot the 1-min averaged 2.4MeV proton flux as measured by the EPS instrument onboard GOES-12 on March 22, 2008: | ||
<div style="border: 1px solid LightGray; background-color:#F9F9F9; padding: 10px;"> | <div style="border: 1px solid LightGray; background-color:#F9F9F9; padding: 0px 10px; margin-left: 5px; margin-right: 5px;"> | ||
SPEDAS> goes_load_data, trange=['2008-03-22', '2008-03-23'], datatype='eps', probes='12', /avg_1m | SPEDAS> goes_load_data, trange=['2008-03-22', '2008-03-23'], datatype='eps', probes='12', /avg_1m | ||
| Line 29: | Line 30: | ||
</div> | </div> | ||
We can also plot the integral flux of electrons at 0.6 MeV: | We can also plot the integral flux of electrons at 0.6 MeV: | ||
<div style="border: 1px solid LightGray; background-color:#F9F9F9; padding: 10px;"> | <div style="border: 1px solid LightGray; background-color:#F9F9F9; padding: 0px 10px; margin-left: 5px; margin-right: 5px;"> | ||
SPEDAS> tplot, 'g12_elec_0.6MeV_iflux' | SPEDAS> tplot, 'g12_elec_0.6MeV_iflux' | ||
</div> | </div> | ||
| Line 35: | Line 36: | ||
==== X-ray Sensor (XRS) ==== | ==== X-ray Sensor (XRS) ==== | ||
To load and plot the 1-min averaged X-ray flux as measured by the XRS instrument onboard GOES-10 on March, 22, 2008: | To load and plot the 1-min averaged X-ray flux as measured by the XRS instrument onboard GOES-10 on March, 22, 2008: | ||
<div style="border: 1px solid LightGray; background-color:#F9F9F9; padding: 10px;"> | <div style="border: 1px solid LightGray; background-color:#F9F9F9; padding: 0px 10px; margin-left: 5px; margin-right: 5px;"> | ||
SPEDAS> goes_load_data, trange=['2008-03-22', '2008-03-23'], datatype='xrs', probes='10', /avg_1m | SPEDAS> goes_load_data, trange=['2008-03-22', '2008-03-23'], datatype='xrs', probes='10', /avg_1m | ||
| Line 49: | Line 50: | ||
==== Fluxgate Magnetometer (FGM) ==== | ==== Fluxgate Magnetometer (FGM) ==== | ||
Load and plot 1-min averaged data for both FGM sensors on GOES-15 for the day of March 17, 2013: | Load and plot 1-min averaged data for both FGM sensors on GOES-15 for the day of March 17, 2013: | ||
<div style="border: 1px solid LightGray; background-color:#F9F9F9; padding: 10px;"> | <div style="border: 1px solid LightGray; background-color:#F9F9F9; padding: 0px 10px; margin-left: 5px; margin-right: 5px;"> | ||
SPEDAS> goes_load_data, trange=['2013-03-17', '2013-03-18'], datatype='fgm', probes='15', /avg_1m | SPEDAS> goes_load_data, trange=['2013-03-17', '2013-03-18'], datatype='fgm', probes='15', /avg_1m | ||
| Line 56: | Line 57: | ||
==== Magnetospheric Electron Detector (MAGED) ==== | ==== Magnetospheric Electron Detector (MAGED) ==== | ||
Load and plot 1-min averaged, corrected (for deadtimes) flux of 40keV, 75keV electrons measured by the MAGED instrument on GOES-15 for the day of March 17, 2013: | Load and plot 1-min averaged, corrected (for deadtimes) flux of 40keV, 75keV electrons measured by the MAGED instrument on GOES-15 for the day of March 17, 2013: | ||
<div style="border: 1px solid LightGray; background-color:#F9F9F9; padding: 10px;"> | <div style="border: 1px solid LightGray; background-color:#F9F9F9; padding: 0px 10px; margin-left: 5px; margin-right: 5px;"> | ||
SPEDAS> goes_load_data, trange=['2013-03-17', '2013-03-18'], datatype='maged', probes='15', /avg_1m | SPEDAS> goes_load_data, trange=['2013-03-17', '2013-03-18'], datatype='maged', probes='15', /avg_1m | ||
| Line 62: | Line 63: | ||
</div> | </div> | ||
To calculate the pitch angles corresponding to each MAGED telescope head (FGM data must be loaded): | To calculate the pitch angles corresponding to each MAGED telescope head (FGM data must be loaded): | ||
<div style="border: 1px solid LightGray; background-color:#F9F9F9; padding: 10px;"> | <div style="border: 1px solid LightGray; background-color:#F9F9F9; padding: 0px 10px; margin-left: 5px; margin-right: 5px;"> | ||
SPEDAS> goes_lib ; compile the GOES library routines | SPEDAS> goes_lib ; compile the GOES library routines | ||
| Line 75: | Line 76: | ||
==== Magnetospheric Proton Detector (MAGPD) ==== | ==== Magnetospheric Proton Detector (MAGPD) ==== | ||
Load and plot the 95 keV proton flux from the MAGPD instrument onboard GOES-15 for the day of March 17, 2013: | Load and plot the 95 keV proton flux from the MAGPD instrument onboard GOES-15 for the day of March 17, 2013: | ||
<div style="border: 1px solid LightGray; background-color:#F9F9F9; padding: 10px;"> | <div style="border: 1px solid LightGray; background-color:#F9F9F9; padding: 0px 10px; margin-left: 5px; margin-right: 5px;"> | ||
SPEDAS> goes_load_data, trange=['2013-03-17', '2013-03-18'], datatype='magpd', probes='15', /avg_1m | SPEDAS> goes_load_data, trange=['2013-03-17', '2013-03-18'], datatype='magpd', probes='15', /avg_1m | ||
| Line 82: | Line 83: | ||
==== Electron, Proton, Alpha Detector (EPEAD) ==== | ==== Electron, Proton, Alpha Detector (EPEAD) ==== | ||
Load and plot the 2.5MeV, uncorrected proton flux as observed by the GOES-15 EPEAD instrument for the day of March 17, 2013: | Load and plot the 2.5MeV, uncorrected proton flux as observed by the GOES-15 EPEAD instrument for the day of March 17, 2013: | ||
<div style="border: 1px solid LightGray; background-color:#F9F9F9; padding: 10px;"> | <div style="border: 1px solid LightGray; background-color:#F9F9F9; padding: 0px 10px; margin-left: 5px; margin-right: 5px;"> | ||
SPEDAS> goes_load_data, trange=['2013-03-17', '2013-03-18'], datatype='epead', probes='15', /avg_1m | SPEDAS> goes_load_data, trange=['2013-03-17', '2013-03-18'], datatype='epead', probes='15', /avg_1m | ||
| Line 89: | Line 90: | ||
To calculate and plot the center pitch angles for the east and west heads of the EPEAD instrument, first load the FGM data: | To calculate and plot the center pitch angles for the east and west heads of the EPEAD instrument, first load the FGM data: | ||
<div style="border: 1px solid LightGray; background-color:#F9F9F9; padding: 10px;"> | <div style="border: 1px solid LightGray; background-color:#F9F9F9; padding: 0px 10px; margin-left: 5px; margin-right: 5px;"> | ||
SPEDAS> goes_load_data, trange=['2013-03-17', '2013-03-18'], datatype='fgm', probes='15', /avg_1m | SPEDAS> goes_load_data, trange=['2013-03-17', '2013-03-18'], datatype='fgm', probes='15', /avg_1m | ||
</div> | </div> | ||
then compile the GOES library file, goes_lib: | then compile the GOES library file, goes_lib: | ||
<div style="border: 1px solid LightGray; background-color:#F9F9F9; padding: 10px;"> | <div style="border: 1px solid LightGray; background-color:#F9F9F9; padding: 0px 10px; margin-left: 5px; margin-right: 5px;"> | ||
SPEDAS> goes_lib ; compile GOES support routines | SPEDAS> goes_lib ; compile GOES support routines | ||
</div> | </div> | ||
and finally use goes_epead_center_pitch_angles to calculate the pitch angles from the magnetic field in spacecraft coordinates: | and finally use goes_epead_center_pitch_angles to calculate the pitch angles from the magnetic field in spacecraft coordinates: | ||
<div style="border: 1px solid LightGray; background-color:#F9F9F9; padding: 10px;"> | <div style="border: 1px solid LightGray; background-color:#F9F9F9; padding: 0px 10px; margin-left: 5px; margin-right: 5px;"> | ||
SPEDAS> goes_epead_center_pitch_angles, 'g15_Bsc_1', 'g15_BTSC_1' | SPEDAS> goes_epead_center_pitch_angles, 'g15_Bsc_1', 'g15_BTSC_1' | ||
| Line 107: | Line 108: | ||
==== High Energy Proton and Alpha Detector (HEPAD) ==== | ==== High Energy Proton and Alpha Detector (HEPAD) ==== | ||
Load and plot the 375MeV proton flux as observed by the GOES-15 HEPAD instrument for the day of March 17, 2013: | Load and plot the 375MeV proton flux as observed by the GOES-15 HEPAD instrument for the day of March 17, 2013: | ||
<div style="border: 1px solid LightGray; background-color:#F9F9F9; padding: 10px;"> | <div style="border: 1px solid LightGray; background-color:#F9F9F9; padding: 0px 10px; margin-left: 5px; margin-right: 5px;"> | ||
SPEDAS> goes_load_data, trange=['2013-03-17', '2013-03-18'], datatype='hepad', probes='15', /avg_1m | SPEDAS> goes_load_data, trange=['2013-03-17', '2013-03-18'], datatype='hepad', probes='15', /avg_1m | ||
| Line 114: | Line 115: | ||
==== X-ray Sensor (XRS) ==== | ==== X-ray Sensor (XRS) ==== | ||
Load and plot the X-rays measured by the GOES-15 XRS instrument for the day of March 17, 2013: | Load and plot the X-rays measured by the GOES-15 XRS instrument for the day of March 17, 2013: | ||
<div style="border: 1px solid LightGray; background-color:#F9F9F9; padding: 10px;"> | <div style="border: 1px solid LightGray; background-color:#F9F9F9; padding: 0px 10px; margin-left: 5px; margin-right: 5px;"> | ||
SPEDAS> goes_load_data, trange=['2013-03-17', '2013-03-18'], datatype='xrs', probes='15', /avg_1m | SPEDAS> goes_load_data, trange=['2013-03-17', '2013-03-18'], datatype='xrs', probes='15', /avg_1m | ||
Revision as of 17:28, 1 April 2014

SPEDAS provides command-line and GUI access for loading, processing and analyzing GOES space physics data. The GOES data is made available by the NOAA National Geophysical Data Center (NGDC).
To check the data availability for a specific GOES spacecraft/instrument on a certain day, use the data availability tool: GOES Data Availability
GOES Space Environment Monitor (SEM)
GOES-15 summary plot - 14 days
GOES-15 summary plot - 108 days
GOES 8-12 SEM Data
For a full description of the GOES 8-12 instruments and their data products, see the GOES 8-12 databook
Examples
Fluxgate Magnetometer (FGM)
To load and plot the magnetic field measured by the FGM instrument onboard GOES-12 on 3/22/2008:
SPEDAS> goes_load_data, trange=['2008-03-22', '2008-03-23'], datatype='fgm', probes='12', /avg_1m
SPEDAS> tplot, 'g12_H_enp'
Energetic Particle Sensor (EPS)
Load and plot the 1-min averaged 2.4MeV proton flux as measured by the EPS instrument onboard GOES-12 on March 22, 2008:
SPEDAS> goes_load_data, trange=['2008-03-22', '2008-03-23'], datatype='eps', probes='12', /avg_1m
SPEDAS> tplot, 'g12_prot_2.4MeV_flux'
We can also plot the integral flux of electrons at 0.6 MeV:
SPEDAS> tplot, 'g12_elec_0.6MeV_iflux'
X-ray Sensor (XRS)
To load and plot the 1-min averaged X-ray flux as measured by the XRS instrument onboard GOES-10 on March, 22, 2008:
SPEDAS> goes_load_data, trange=['2008-03-22', '2008-03-23'], datatype='xrs', probes='10', /avg_1m
SPEDAS> tplot, 'g10_xrs_avg'
GOES 13-15 SEM Data
To check the current status of the GOES 13-15 data, see GOES 13-15 status
For a full description of the GOES 13-15 instruments and their data products, see the GOES 13-15 databook
Examples
Fluxgate Magnetometer (FGM)
Load and plot 1-min averaged data for both FGM sensors on GOES-15 for the day of March 17, 2013:
SPEDAS> goes_load_data, trange=['2013-03-17', '2013-03-18'], datatype='fgm', probes='15', /avg_1m
SPEDAS> tplot, 'g15_H_enp_*'
Magnetospheric Electron Detector (MAGED)
Load and plot 1-min averaged, corrected (for deadtimes) flux of 40keV, 75keV electrons measured by the MAGED instrument on GOES-15 for the day of March 17, 2013:
SPEDAS> goes_load_data, trange=['2013-03-17', '2013-03-18'], datatype='maged', probes='15', /avg_1m
SPEDAS> tplot, ['g15_maged_40keV_dtc_cor_flux', 'g15_maged_75keV_dtc_cor_flux']
To calculate the pitch angles corresponding to each MAGED telescope head (FGM data must be loaded):
SPEDAS> goes_lib ; compile the GOES library routines
SPEDAS> goes_pitch_angles, 'g15_H_enp_1', 'g15_HT_1', prefix = 'g15'
SPEDAS> tplot, 'g15_pitch_angles'
-
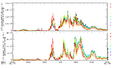
MAGED data at 40 keV, 75 keV, March 17, 2013
-
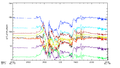
GOES-15 pitch angles, March 17, 2013


Magnetospheric Proton Detector (MAGPD)
Load and plot the 95 keV proton flux from the MAGPD instrument onboard GOES-15 for the day of March 17, 2013:
SPEDAS> goes_load_data, trange=['2013-03-17', '2013-03-18'], datatype='magpd', probes='15', /avg_1m
SPEDAS> tplot, 'g15_magpd_95keV_dtc_cor_flux'
Electron, Proton, Alpha Detector (EPEAD)
Load and plot the 2.5MeV, uncorrected proton flux as observed by the GOES-15 EPEAD instrument for the day of March 17, 2013:
SPEDAS> goes_load_data, trange=['2013-03-17', '2013-03-18'], datatype='epead', probes='15', /avg_1m
SPEDAS> tplot, 'g15_prot_2.5MeV_uncor_flux'
To calculate and plot the center pitch angles for the east and west heads of the EPEAD instrument, first load the FGM data:
SPEDAS> goes_load_data, trange=['2013-03-17', '2013-03-18'], datatype='fgm', probes='15', /avg_1m
then compile the GOES library file, goes_lib:
SPEDAS> goes_lib ; compile GOES support routines
and finally use goes_epead_center_pitch_angles to calculate the pitch angles from the magnetic field in spacecraft coordinates:
SPEDAS> goes_epead_center_pitch_angles, 'g15_Bsc_1', 'g15_BTSC_1'
SPEDAS> tplot, 'goes_epead_center_pitch_angles'
High Energy Proton and Alpha Detector (HEPAD)
Load and plot the 375MeV proton flux as observed by the GOES-15 HEPAD instrument for the day of March 17, 2013:
SPEDAS> goes_load_data, trange=['2013-03-17', '2013-03-18'], datatype='hepad', probes='15', /avg_1m
SPEDAS> tplot, 'g15_hepadp_375MeV_flux'
X-ray Sensor (XRS)
Load and plot the X-rays measured by the GOES-15 XRS instrument for the day of March 17, 2013:
SPEDAS> goes_load_data, trange=['2013-03-17', '2013-03-18'], datatype='xrs', probes='15', /avg_1m
SPEDAS> tplot, 'g15_xrs_avg'
-
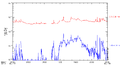
GOES-15 X-ray Flux on March 17, 2013
