MMS Fly's Eye Energetic Particle Sensor: Difference between revisions
No edit summary |
No edit summary |
||
| Line 55: | Line 55: | ||
== Examples == | == Examples == | ||
=== Sector-Time Spectrograms, No Sun Contamination | === Sector-Time Spectrograms, No Sun Contamination Removed === | ||
To create sector spectrograms of FEEPS data on January 20, 2016: | To create sector spectrograms of FEEPS data on January 20, 2016: | ||
| Line 72: | Line 72: | ||
<gallery widths=300px heights=250px align="center"> | <gallery widths=300px heights=250px align="center"> | ||
FEEPS_Sector_Time_Spectrograms_plot.png|MMS1 FEEPS Sector-Time Spectrogram on January 20, 2016 | FEEPS_Sector_Time_Spectrograms_plot.png|MMS1 FEEPS Sector-Time Spectrogram on January 20, 2016 | ||
</gallery> | |||
=== Sector-Time Spectrograms, With Sun Contamination removed === | |||
To create sector spectrograms of FEEPS data on January 20, 2016: | |||
<div style="border: 1px solid LightGray; background-color:#F9F9F9; padding: 0px 10px; margin-left: 5px; margin-right: 5px;"> | |||
MMS> mms_load_feeps, trange=['2016-01-20/19:50', '2016-01-20/19:55'], probe=1, data_rate='brst', level='12', /time_clip | |||
MMS> feeps_sector_spec, probe=1, data_rate='brst', /remove_sun | |||
MMS> tplot, ['mms1_epd_feeps_bottom_electron_count_rate_sensorid_3_sun_removed_sectspec', $ | |||
'mms1_epd_feeps_bottom_electron_count_rate_sensorid_4_sun_removed_sectspec', $ | |||
'mms1_epd_feeps_bottom_electron_count_rate_sensorid_5_sun_removed_sectspec', $ | |||
'mms1_epd_feeps_bottom_electron_count_rate_sensorid_10_sun_removed_sectspec', $ | |||
'mms1_epd_feeps_bottom_electron_count_rate_sensorid_11_sun_removed_sectspec'] | |||
</div> | |||
<gallery widths=300px heights=250px align="center"> | |||
FEEPS_Sector_Time_Spectrograms_plot_sun_removed.png|MMS1 FEEPS Sector-Time Spectrogram With Sun Contamination Removed | |||
</gallery> | </gallery> | ||
Revision as of 17:08, 24 May 2016

SPEDAS provides command line and GUI access to the MMS FEEPS data.
Prior to using these data, please read the FEEPS Release Notes:
https://lasp.colorado.edu/galaxy/display/mms/FEEPS+Release+Notes
FEEPS Data
For more complete examples, see the FEEPS crib sheets located in the /mms/examples/ folder.
Examples
Electron Data
To load and plot the MMS1 FEEPS electron data on March 7, 2016:
MMS> mms_load_feeps, datatype='electron', trange=['2016-02-15', '2016-02-16'], probe=1, datarate='srvy'
MMS> tplot, 'mms1_epd_feeps_electron_intensity_omni_spin'
-
MMS1 FEEPS electron omni spin data on February 15, 2016

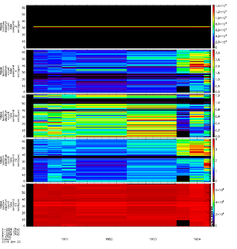
Ion Data
To load and plot the MMS1 FEEPS electron data on March 7, 2016:
MMS> mms_load_feeps, datatype='ion', trange=['2016-02-15', '2016-02-16'], probe=1, datarate='srvy'
MMS> tplot, 'mms1_epd_ion_electron_intensity_omni_spin'
-
MMS1 FEEPS ion omni spin data on February 15, 2016

Quicklook Plots
To create FEEPS Quicklook plots use the crib mms_load_feeps_crib_qlplots.pro This crib will load electron and ion data. It shows the user how to use mms_feeps_pad to calculate the pitch angle distributions. In addition spacecraft ephemeris data, FGM B-field data and data availability are loaded and displayed.
MMS> mms_load_feeps, datatype='ion', trange=['2016-02-15', '2016-02-16'], probe=1, datarate='srvy'
-
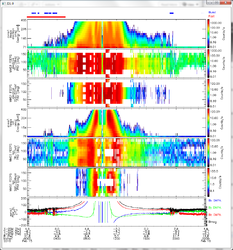
MMS1 FEEPS Quick Look data from February 15, 2016
FEEPS Sector Spectrograms
Examples
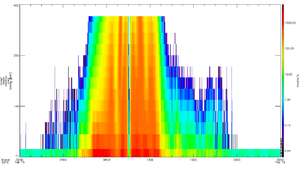
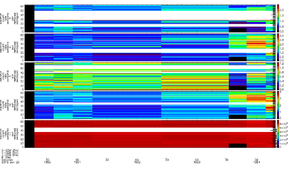
Sector-Time Spectrograms, No Sun Contamination Removed
To create sector spectrograms of FEEPS data on January 20, 2016:
MMS> mms_load_feeps, trange=['2016-01-20/19:50', '2016-01-20/19:55'], probe=1, data_rate='brst', level='12', /time_clip
MMS> feeps_sector_spec, probe=1, data_rate='brst'
MMS> tplot, ['mms1_epd_feeps_bottom_electron_count_rate_sensorid_3_sectspec', $ 'mms1_epd_feeps_bottom_electron_count_rate_sensorid_4_sectspec', $ 'mms1_epd_feeps_bottom_electron_count_rate_sensorid_5_sectspec', $ 'mms1_epd_feeps_bottom_electron_count_rate_sensorid_10_sectspec', $ 'mms1_epd_feeps_bottom_electron_count_rate_sensorid_11_sectspec']
-
MMS1 FEEPS Sector-Time Spectrogram on January 20, 2016

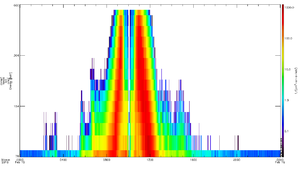
Sector-Time Spectrograms, With Sun Contamination removed
To create sector spectrograms of FEEPS data on January 20, 2016:
MMS> mms_load_feeps, trange=['2016-01-20/19:50', '2016-01-20/19:55'], probe=1, data_rate='brst', level='12', /time_clip
MMS> feeps_sector_spec, probe=1, data_rate='brst', /remove_sun
MMS> tplot, ['mms1_epd_feeps_bottom_electron_count_rate_sensorid_3_sun_removed_sectspec', $ 'mms1_epd_feeps_bottom_electron_count_rate_sensorid_4_sun_removed_sectspec', $ 'mms1_epd_feeps_bottom_electron_count_rate_sensorid_5_sun_removed_sectspec', $ 'mms1_epd_feeps_bottom_electron_count_rate_sensorid_10_sun_removed_sectspec', $ 'mms1_epd_feeps_bottom_electron_count_rate_sensorid_11_sun_removed_sectspec']
-
MMS1 FEEPS Sector-Time Spectrogram With Sun Contamination Removed
