Mouse and Keyboard Events - SPEDAS GUI
Tracking

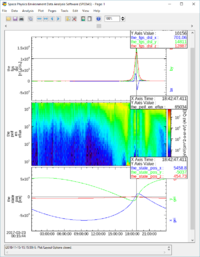
When tracking is enabled any movement within the frame of a panel in the draw area will be tracked. Tracking can be toggled on and off from the Graph pull down menu. The user can choose to track one panel or all panels. In addition the user can track vertically, horizontally or both. When the GUI session is first started, tracking of all panels is on by default and tracking both vertically and horizontally. The figure to the right shows an example of the main graph area when tracking is turned on and tracking all panels. Changing the tracking settings will affect what information is displayed in the legend, and which panels the legend is displayed on.
Legend
When tracking is on a legend will be appear in the upper right corner of each panel that is being tracked. The values of each data point intersecting the vertical tracking line are displayed. The user can choose to turn the position legend on or off by toggling the Position Legend under the View menu. The legend is on by default. If only one panel is being tracked, then only one panel will have a legend. The legend does not appear in exports or prints. See the figure to the right.
Mouse Clicks
The mouse button offers several ways to interact with the GUI and the graph area. Mouse clicks include Single Click (left button), Right Click, Ctrl-Click-Drag, and Click-Drag.
Single Click: There are two possible events that a single click will generate. One is when marker(s) are present and the user clicks within the highlighted area of a marker, the other is when the user clicks outside of a marker but within the graph area. Which graph options window is displayed depends on where within the graph area the mouse button was clicked.
There are 6 options.
- Page
- Any area that is outside of a panel, axis, label, or variable display will bring up the Page Options Window. In the event the GUI cannot determine which object was clicked, the Page Options Window will be opened.
- Panel
- When the user clicks within the frame of any panel, the Panel Options window is displayed
- Legend
- When the user clicks within the frame of any legend, the Legend Options window for that panel will be displayed.
- X-Axis
- When the user clicks on the X Axis the Axis Options panel is displayed.
- Y-Axis
- When the user clicks on the X Axis the Axis Options panel is displayed.
- Variables
- If variables are present the user can click in the variable display area to open the Variable Options window.
Please note that resolution and screen size vary between machines and platforms. If you click close to another option in the draw and do not get the window you wanted, try clicking more in the middle of the area you want.
Right Click: Clicking the right mouse button will bring up a context menu containing the most commonly used options associated with plotting and data analysis. The context menu contains the following menu items:
- Panel Options
- Layout Options
- Legend Options
- Nudge Traces
- Subset
- Calculate
- Data Processing
Keyboard Events
There are two kinds of keyboard events, scrolling and expanding/reducing.
Scroll: The user can scroll the panels in the active page forward or backward by using the left and right arrow keys. The plot will be moved forward or backward in time by one major tick length.
Reduce/Expand: The panels can also be reduced or expanded by using Backspace or Tab keys. Tab will expand the panels horizontally by two major tick lengths (one major tick length is added to both the left and right sides of the x axis). Similarly, Backspace will reduce the panels displayed by two major tick lengths.
Accelerator Keys: Standard accelerator keys are available for the more frequently used functions. Accelerator keys include:
- Ctrl-O – Opens an existing THEMIS GUI Document
- Ctrl-S – Saves a THEMIS GUI Document
- Ctrl-Z – Close page
- Ctrl-P – Print page
- Ctrl-Q - Quit
- Ctrl-R - Refresh
- Ctrl-C - Copy
Markers
Marking is a feature that allows the user to mark or select regions of interest in panels on the active page. If “Track All” is set in the Graph menu then all panels will be marked; if “Track One Panel” is set then only the panel the cursor is in is marked.

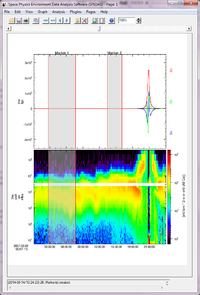
A Ctrl-Click-Drag operation is used to create a marker. If the cursor leaves the draw area, marking will be canceled. The figure to the right shows examples of two markers, one created while all panels were being tracked, the other with only one panel tracking.
Marker Color Codes:
- Green
- Indicates that the cursor is currently within the marker
- Blue
- Indicates the user has clicked the mouse button within that marker to make it ‘Active’ or the currently selected marker. Only one marker can be active at a time.
- Red
- Represents all other markers (not active or the cursor is not within its area)
When a marker is ‘active’ (blue boundary lines) there are additional functions you can perform on the marker. To delete a marker select the Delete Marker option under the Edit pull down menu. To display only the marked area, select the Subset option under the Edit pull down menu. A new page will be created and displayed containing only the marked area.
Selecting Specific Regions
Click and drag over an area in the draw window to create a new page containing the selected region. A rubberband box will be drawn to denote the selected area. If the cursor leaves the draw area the zoom will be canceled. If the “Rubberband for X only” options is set (graph menu) then only the selected region’s X range will be constrained when the new page is created. If that option is off the new page’s plots will use the selected region’s X and Y bounds
Zoom In/Out
In addition to zooming into marked regions and/or rectangular areas the user can also choose to modify the size of the visible area by using the zoom spinner widget on the toolbar. The zoom spinner allows the user to increase or decrease the size of the visible region by entering a percent value of the original page size. The user should be aware that when zooming in and out of the page, the main graph area will not change in size, only the page will.