Wavelet
Compare IDL code to python code for the wavelet transformation of a simple wave function.
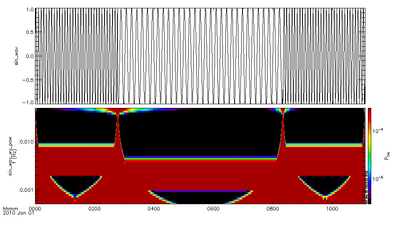
IDL code: SPEDAS
The SPEDAS IDL code uses Complex Morlet wavelets internally, and computes the resulting power.
  t =  FINDGEN(4000)
  time = time_double('2010-01-01') + 10*t
  data = sin(2*!pi*t/32.)
  data2 = sin(2*!pi*t/64.)
  data[1000:3000] = data2[1000:3000]

  var = 'sin_wav'
  store_data, var, data={x:time, y:data}

  pvar = 'sin_wav_wv_pow'
  wav_data, var
  tplot, [var, pvar]
Python code: pySPEDAS
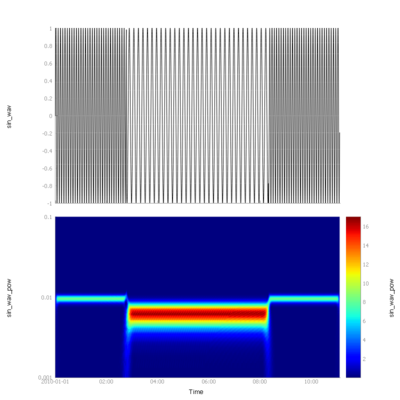
Similar code in python uses the pywavelets library. This example uses the Complex Morlet wavelets.
import numpy as np
import pytplot
import pyspedas
from pyspedas.analysis.wavelet import wavelet

t = np.arange(4000.)
y = np.sin(2*np.pi*t/32.)
y2 = np.sin(2*np.pi*t/64.)
y[1000:3000] = y2[1000:3000]

var = 'sin_wav'
time = pyspedas.time_float('2010-01-01') + 10*t

pytplot.store_data(var, data={'x':time, 'y':y})

# Complex Morlet wavelets transformation
powervar = wavelet(var, wavename='cmorl0.5-1.0')
pvar = powervar[0]

pytplot.tplot_names()

pytplot.options(pvar, 'colormap', 'jet')
pytplot.ylim(pvar, 0.001, 0.1)
pytplot.options(pvar, 'ylog', True)
pytplot.options(pvar, 'ytitle', pvar)
pytplot.tplot([var, pvar])
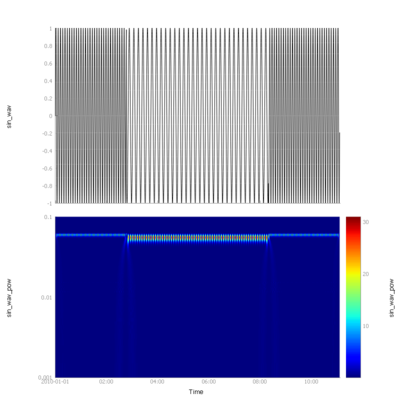
With a small change, we can use a different wavelet, for example the Gaussian Derivative wavelet.
import numpy as np
import pytplot
import pyspedas
from pyspedas.analysis.wavelet import wavelet

t = np.arange(4000.)
y = np.sin(2*np.pi*t/32.)
y2 = np.sin(2*np.pi*t/64.)
y[1000:3000] = y2[1000:3000]

var = 'sin_wav'
time = pyspedas.time_float('2010-01-01') + 10*t

pytplot.store_data(var, data={'x':time, 'y':y})

# Gaussian Derivative wavelets transformation
powervar = wavelet(var, wavename='gaus1')
pvar = powervar[0]

pytplot.tplot_names()

pytplot.options(pvar, 'colormap', 'jet')
pytplot.ylim(pvar, 0.001, 0.1)
pytplot.options(pvar, 'ylog', True)
pytplot.options(pvar, 'ytitle', pvar)
pytplot.tplot([var, pvar])


