MMS Fluxgate Magnetometer: Difference between revisions
(adding syntax highlighting to code snippets) |
|||
| (One intermediate revision by the same user not shown) | |||
| Line 14: | Line 14: | ||
=== Magnetometer Data === | === Magnetometer Data === | ||
To load and plot MMS FGM data on February 15, 2016: | To load and plot MMS FGM data on February 15, 2016: | ||
< | <syntaxhighlight lang="idl"> | ||
MMS> mms_load_fgm, trange=['2016-02-15', '2016-02-16'], probe=1 | MMS> mms_load_fgm, trange=['2016-02-15', '2016-02-16'], probe=1 | ||
MMS> tplot, 'mms1_fgm_b_gsm_srvy_l2_bvec' | MMS> tplot, 'mms1_fgm_b_gsm_srvy_l2_bvec' | ||
</ | </syntaxhighlight> | ||
<gallery widths=300px heights=250px align="center"> | <gallery widths=300px heights=250px align="center"> | ||
| Line 26: | Line 26: | ||
=== Burst Data === | === Burst Data === | ||
To load and plot MMS Burst FGM data on | To load and plot MMS Burst FGM data on October 15, 2015: | ||
< | <syntaxhighlight lang="idl"> | ||
MMS> mms_load_fgm, trange=['2015-10-15', '2015-10-16'], probe=1, data_rate='brst', level='l2' | MMS> mms_load_fgm, trange=['2015-10-15', '2015-10-16'], probe=1, data_rate='brst', level='l2' | ||
| Line 34: | Line 34: | ||
MMS> tlimit, ['2015-10-15/6:45', '2015-10-15/7:20'] | MMS> tlimit, ['2015-10-15/6:45', '2015-10-15/7:20'] | ||
</ | </syntaxhighlight> | ||
<gallery widths=300px heights=250px align="center"> | <gallery widths=300px heights=250px align="center"> | ||
FGM Burst Data Plots.png|MMS1 FGM survey data on February 15, 2016 | FGM Burst Data Plots.png|MMS1 FGM survey data on February 15, 2016 | ||
</gallery> | </gallery> | ||
Latest revision as of 19:20, 29 March 2018

SPEDAS provides command line and GUI access to the MMS FGM data.
For more information on the FGM instrument, see the Data Products Guide:
https://lasp.colorado.edu/mms/sdc/public/datasets/fields/ (FGM Data Products Guide 2016Apr20)
FGM Data
For more complete examples, see the FGM crib sheets located in the /projects/mms/examples/ folder.
Examples
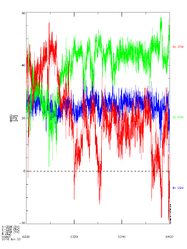
Magnetometer Data
To load and plot MMS FGM data on February 15, 2016: <syntaxhighlight lang="idl"> MMS> mms_load_fgm, trange=['2016-02-15', '2016-02-16'], probe=1
MMS> tplot, 'mms1_fgm_b_gsm_srvy_l2_bvec'
</syntaxhighlight>
-
MMS1 FGM survey data on February 15, 2016
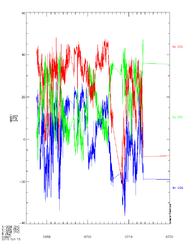
Burst Data
To load and plot MMS Burst FGM data on October 15, 2015: <syntaxhighlight lang="idl"> MMS> mms_load_fgm, trange=['2015-10-15', '2015-10-16'], probe=1, data_rate='brst', level='l2'
MMS> tplot, 'mms1_fgm_b_gse_brst_l2_bvec'
MMS> tlimit, ['2015-10-15/6:45', '2015-10-15/7:20']
</syntaxhighlight>
-
MMS1 FGM survey data on February 15, 2016

