MMS Search Coil Magnetometer: Difference between revisions
No edit summary |
No edit summary |
||
| Line 13: | Line 13: | ||
=== Srvy mode data === | === Srvy mode data === | ||
To load and plot the MMS4 SCM data on October 16, 2016: | To load and plot the MMS4 SCM data on October 16, 2016: | ||
< | <syntaxhighlight lang="idl"> | ||
MMS> mms_load_scm, datatype='scsrvy', trange=['2015-10-16', '2015-10-17'], probe=4 | MMS> mms_load_scm, datatype='scsrvy', trange=['2015-10-16', '2015-10-17'], probe=4 | ||
MMS> tplot, 'mms4_scm_acb_gse_scsrvy_srvy_l2' | MMS> tplot, 'mms4_scm_acb_gse_scsrvy_srvy_l2' | ||
</ | </syntaxhighlight> | ||
<gallery widths=300px heights=250px align="center"> | <gallery widths=300px heights=250px align="center"> | ||
| Line 26: | Line 26: | ||
=== Burst mode data === | === Burst mode data === | ||
To load and plot the burst mode data on October 16, 2015: | To load and plot the burst mode data on October 16, 2015: | ||
< | <syntaxhighlight lang="idl"> | ||
MMS> mms_load_scm, data_rate='brst', trange=['2015-10-16/13:00', '2015-10-16/13:10'], probe=4 | MMS> mms_load_scm, data_rate='brst', trange=['2015-10-16/13:00', '2015-10-16/13:10'], probe=4 | ||
MMS> tplot, 'mms4_scm_acb_gse_scb_brst_l2' | MMS> tplot, 'mms4_scm_acb_gse_scb_brst_l2' | ||
</ | </syntaxhighlight> | ||
<gallery widths=300px heights=250px align="center"> | <gallery widths=300px heights=250px align="center"> | ||
Mms4_scm_brst_gse.png|MMS4 SCM brst-mode data from 13:00 to 13:10UT on October 16, 2015 | Mms4_scm_brst_gse.png|MMS4 SCM brst-mode data from 13:00 to 13:10UT on October 16, 2015 | ||
</gallery> | </gallery> | ||
Latest revision as of 19:21, 29 March 2018

SPEDAS provides command line and GUI access to the MMS search-coil magnetometer (SCM) data, as well as several tools for analyzing SCM data.
The SCM Data Products Guide can be found at:
https://lasp.colorado.edu/mms/sdc/public/datasets/fields/ (Science Data Products Guide vol2 SCM v11 20160301)
SCM Data
For more complete examples, see the SCM crib sheets located in the /mms/examples/ folder.
Examples
Srvy mode data
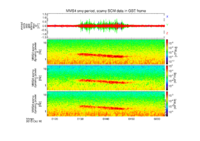
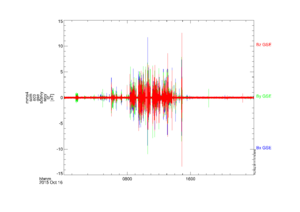
To load and plot the MMS4 SCM data on October 16, 2016: <syntaxhighlight lang="idl"> MMS> mms_load_scm, datatype='scsrvy', trange=['2015-10-16', '2015-10-17'], probe=4
MMS> tplot, 'mms4_scm_acb_gse_scsrvy_srvy_l2'
</syntaxhighlight>
-
MMS4 SCM srvy-mode data on October 16, 2015
Burst mode data
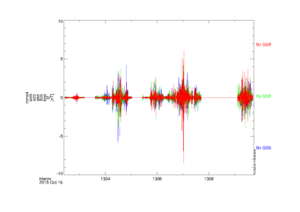
To load and plot the burst mode data on October 16, 2015: <syntaxhighlight lang="idl"> MMS> mms_load_scm, data_rate='brst', trange=['2015-10-16/13:00', '2015-10-16/13:10'], probe=4
MMS> tplot, 'mms4_scm_acb_gse_scb_brst_l2' </syntaxhighlight>
-
MMS4 SCM brst-mode data from 13:00 to 13:10UT on October 16, 2015

