GOES

SPEDAS provides command-line and GUI access for loading, processing and analyzing GOES space physics data. The GOES data is made available by the NOAA National Geophysical Data Center (NGDC).
To check the data availability for a specific GOES spacecraft/instrument on a certain day, use the data availability tool: GOES Data Availability. Before using this data, see the Rules of the Road
Acknowledgements
When using these data, please acknowledge NOAA as follows: 'The GOES 8-15 X-ray / magnetic field / particle data are produced in real time by the NOAA Space Weather Prediction Center (SWPC) and are distributed by the NOAA National Geophysical Data Center (NGDC).'
GOES Space Environment Monitor (SEM)
GOES-15 summary plot - 14 days
GOES-15 summary plot - 108 days
GOES 8-12 SEM Data
For a full description of the GOES 8-12 instruments and their data products, see the GOES 8-12 databook
Examples
Fluxgate Magnetometer (FGM)
To load and plot the magnetic field measured by the FGM instrument onboard GOES-12 on 3/22/2008: <syntaxhighlight lang="idl"> SPEDAS> goes_load_data, trange=['2008-03-22', '2008-03-23'], datatype='fgm', probes='12', /avg_1m
SPEDAS> tplot, 'g12_H_enp' </syntaxhighlight>
Energetic Particle Sensor (EPS)
Load and plot the 1-min averaged 2.4MeV proton flux as measured by the EPS instrument onboard GOES-12 on March 22, 2008: <syntaxhighlight lang="idl"> SPEDAS> goes_load_data, trange=['2008-03-22', '2008-03-23'], datatype='eps', probes='12', /avg_1m
SPEDAS> tplot, 'g12_prot_2.4MeV_flux' </syntaxhighlight> We can also plot the integral flux of electrons at 0.6 MeV: <syntaxhighlight lang="idl"> SPEDAS> tplot, 'g12_elec_0.6MeV_iflux' </syntaxhighlight>
X-ray Sensor (XRS)
See the XRS Readme for more information on the GOES XRS instrument.
To load and plot the 1-min averaged X-ray flux as measured by the XRS instrument onboard GOES-10 on March, 22, 2008: <syntaxhighlight lang="idl"> SPEDAS> goes_load_data, trange=['2008-03-22', '2008-03-23'], datatype='xrs', probes='10', /avg_1m
SPEDAS> tplot, 'g10_xrs_avg' </syntaxhighlight>
GOES 13-15 SEM Data
To check the current status of the GOES 13-15 data, see GOES 13-15 status
For a full description of the GOES 13-15 instruments and their data products, see the GOES 13-15 databook
Examples
Fluxgate Magnetometer (FGM)
Load and plot 1-min averaged data for both FGM sensors on GOES-15 for the day of March 17, 2013: <syntaxhighlight lang="idl"> SPEDAS> goes_load_data, trange=['2013-03-17', '2013-03-18'], datatype='fgm', probes='15', /avg_1m
SPEDAS> tplot, 'g15_H_enp_*' </syntaxhighlight>
Magnetospheric Electron Detector (MAGED)
Load and plot 1-min averaged, corrected (for deadtimes) flux of 40keV, 75keV electrons measured by the MAGED instrument on GOES-15 for the day of March 17, 2013: <syntaxhighlight lang="idl"> SPEDAS> goes_load_data, trange=['2013-03-17', '2013-03-18'], datatype='maged', probes='15', /avg_1m
SPEDAS> tplot, ['g15_maged_40keV_dtc_cor_flux', 'g15_maged_75keV_dtc_cor_flux'] </syntaxhighlight> To calculate the pitch angles corresponding to each MAGED telescope head (FGM data must be loaded): <syntaxhighlight lang="idl"> SPEDAS> goes_lib ; compile the GOES library routines
SPEDAS> goes_pitch_angles, 'g15_H_enp_1', 'g15_HT_1', prefix = 'g15'
SPEDAS> tplot, 'g15_pitch_angles' </syntaxhighlight>
-
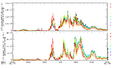
MAGED data at 40 keV, 75 keV, March 17, 2013
-
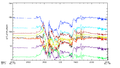
GOES-15 pitch angles, March 17, 2013


Magnetospheric Proton Detector (MAGPD)
Load and plot the 95 keV proton flux from the MAGPD instrument onboard GOES-15 for the day of March 17, 2013: <syntaxhighlight lang="idl"> SPEDAS> goes_load_data, trange=['2013-03-17', '2013-03-18'], datatype='magpd', probes='15', /avg_1m
SPEDAS> tplot, 'g15_magpd_95keV_dtc_cor_flux' </syntaxhighlight>
Electron, Proton, Alpha Detector (EPEAD)
The GOES 13-15 satellites are capable of undergoing a yaw flip, resulting in the EPEAD pointing directions labeled as 'east' and 'west' being switched. Care must be taken to ensure 'east' and 'west' refer to the same directions when comparing EPEAD data from one time interval to another.
To read more on this issue, see the note at NGDC: Note on GOES 13‐15 Solar Protons and Yaw Flips
Load and plot the 2.5MeV, uncorrected proton flux as observed by the GOES-15 EPEAD instrument for the day of March 17, 2013: <syntaxhighlight lang="idl"> SPEDAS> goes_load_data, trange=['2013-03-17', '2013-03-18'], datatype='epead', probes='15', /avg_1m
SPEDAS> tplot, 'g15_prot_2.5MeV_uncor_flux' </syntaxhighlight>
To calculate and plot the center pitch angles for the east and west heads of the EPEAD instrument, first load the FGM data: <syntaxhighlight lang="idl"> SPEDAS> goes_load_data, trange=['2013-03-17', '2013-03-18'], datatype='fgm', probes='15', /avg_1m </syntaxhighlight>
then compile the GOES library file, goes_lib: <syntaxhighlight lang="idl"> SPEDAS> goes_lib ; compile GOES support routines </syntaxhighlight>
and finally use goes_epead_center_pitch_angles to calculate the pitch angles from the magnetic field in spacecraft coordinates: <syntaxhighlight lang="idl"> SPEDAS> goes_epead_center_pitch_angles, 'g15_Bsc_1', 'g15_BTSC_1'
SPEDAS> tplot, 'goes_epead_center_pitch_angles' </syntaxhighlight>
High Energy Proton and Alpha Detector (HEPAD)
Load and plot the 375MeV proton flux as observed by the GOES-15 HEPAD instrument for the day of March 17, 2013: <syntaxhighlight lang="idl"> SPEDAS> goes_load_data, trange=['2013-03-17', '2013-03-18'], datatype='hepad', probes='15', /avg_1m
SPEDAS> tplot, 'g15_hepadp_375MeV_flux' </syntaxhighlight>
X-ray Sensor (XRS)
Load and plot the X-rays measured by the GOES-15 XRS instrument for the day of March 17, 2013: <syntaxhighlight lang="idl"> SPEDAS> goes_load_data, trange=['2013-03-17', '2013-03-18'], datatype='xrs', probes='15', /avg_1m
SPEDAS> tplot, 'g15_xrs_avg' </syntaxhighlight>
-
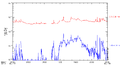
GOES-15 X-ray Flux on March 17, 2013

GOES summary plots
GOES overview plots for 24-hour, 6-hour and 2-hour time spans can be found in the THEMIS web site which also contains links to the NOAA summary plot files (B lowres, dB highres, dB 0.001-1Hz spectra) , if they exist for the particular date.
References
GOES Space Environment Monitor at NGDC
GOES SEM Historical Status - Space Weather Prediction Center