MMS Energetic Ion Spectrometer: Difference between revisions
No edit summary |
No edit summary |
||
| Line 1: | Line 1: | ||
[[File: | [[File:EIS_QuickLook_Plots.png|200px|thumb|right|EIS Quick Look plot in SPEDAS]] | ||
SPEDAS provides command line and GUI access to the MMS EIS data. | SPEDAS provides command line and GUI access to the MMS EIS data. | ||
| Line 14: | Line 14: | ||
MMS> trange=['2015-12-15', '2015-12-16'] | MMS> trange=['2015-12-15', '2015-12-16'] | ||
MMS> mms_load_eis, probes= | MMS> mms_load_eis, probes=1, trange=trange, datatype='extof', level='l1b' | ||
MMS> tplot, '*_extof_proton_flux_omni_spin' | MMS> tplot, '*_extof_proton_flux_omni_spin' | ||
| Line 27: | Line 27: | ||
To load and plot the MMS1 EIS He++ Flux for all channels on December 15, 2015: | To load and plot the MMS1 EIS He++ Flux for all channels on December 15, 2015: | ||
<div style="border: 1px solid LightGray; background-color:#F9F9F9; padding: 0px 10px; margin-left: 5px; margin-right: 5px;"> | <div style="border: 1px solid LightGray; background-color:#F9F9F9; padding: 0px 10px; margin-left: 5px; margin-right: 5px;"> | ||
MMS> mms_load_eis, probes= | MMS> mms_load_eis, probes=1, trange=['2015-12-15', '2015-12-16'], datatype='extof', level='l1b' | ||
MMS> tplot, '*extof_alpha_flux_omni_spin' | MMS> tplot, '*extof_alpha_flux_omni_spin' | ||
| Line 36: | Line 36: | ||
EIS_Heplusplus_Plots.png|MMS1 EIS He++ Flux for all channels on December 15, 2015 | EIS_Heplusplus_Plots.png|MMS1 EIS He++ Flux for all channels on December 15, 2015 | ||
</gallery> | </gallery> | ||
=== Electron Data === | === Electron Data === | ||
To load and plot the | To load and plot the MMS3 electron (electronenergy) data on December 15, 2015: | ||
<div style="border: 1px solid LightGray; background-color:#F9F9F9; padding: 0px 10px; margin-left: 5px; margin-right: 5px;"> | <div style="border: 1px solid LightGray; background-color:#F9F9F9; padding: 0px 10px; margin-left: 5px; margin-right: 5px;"> | ||
MMS> mms_load_eis, | MMS> mms_load_eis, probe=3, trange=['2015-12-15', '2015-12-16'], datatype='electronenergy', level = level | ||
MMS> mms_eis_pad, probe= | MMS> mms_eis_pad, probe=3, species='electron', datatype='electronenergy', data_units='flux', level = level | ||
MMS> tplot, [' | MMS> tplot, ['mms3_epd_eis_electronenergy_electron_flux_omni_spin'] | ||
</div> | </div> | ||
| Line 71: | Line 72: | ||
<div style="border: 1px solid LightGray; background-color:#F9F9F9; padding: 0px 10px; margin-left: 5px; margin-right: 5px;"> | <div style="border: 1px solid LightGray; background-color:#F9F9F9; padding: 0px 10px; margin-left: 5px; margin-right: 5px;"> | ||
MMS> mms_load_eis_crib_qlplots | MMS> mms_load_eis_crib_qlplots | ||
</div> | </div> | ||
<gallery widths=300px heights=250px align="center"> | <gallery widths=300px heights=250px align="center"> | ||
EIS_QuickLook_Plots.png|MMS1 EIS Quick Look Plots, December 15, 2015 | EIS_QuickLook_Plots.png|MMS1 EIS Quick Look Plots, December 15, 2015 | ||
Revision as of 20:09, 24 May 2016

SPEDAS provides command line and GUI access to the MMS EIS data.
EIS Data
For more complete examples, see the EIS crib sheets located in the /mms/examples/ folder.
Examples
H+ Flux
To load and plot the MMS1 EIS H+ Flux for all channels on December 15, 2015:
MMS> trange=['2015-12-15', '2015-12-16']
MMS> mms_load_eis, probes=1, trange=trange, datatype='extof', level='l1b'
MMS> tplot, '*_extof_proton_flux_omni_spin'
-
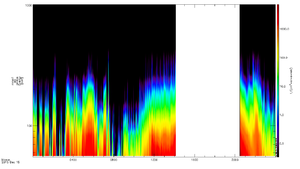
MMS1 EIS H+ Flux for all channels on December 15, 2015

He++ Flux
To load and plot the MMS1 EIS He++ Flux for all channels on December 15, 2015:
MMS> mms_load_eis, probes=1, trange=['2015-12-15', '2015-12-16'], datatype='extof', level='l1b'
MMS> tplot, '*extof_alpha_flux_omni_spin'
-
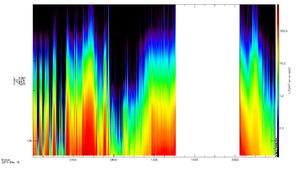
MMS1 EIS He++ Flux for all channels on December 15, 2015

Electron Data
To load and plot the MMS3 electron (electronenergy) data on December 15, 2015:
MMS> mms_load_eis, probe=3, trange=['2015-12-15', '2015-12-16'], datatype='electronenergy', level = level
MMS> mms_eis_pad, probe=3, species='electron', datatype='electronenergy', data_units='flux', level = level
MMS> tplot, ['mms3_epd_eis_electronenergy_electron_flux_omni_spin']
-
MMS3 EIS Electron Energy December 15, 2015

Burst Data
To load and plot the MMS1 EIS electron data on March 7, 2016:
- load ExTOF and electron data
mms_load_eis, probes=probe, trange=trange, datatype='extof', level='l1b' mms_load_eis, probes=probe, trange=trange, datatype='electronenergy', level='l1b'
MMS> mms_load_eis, datatype='electron', trange=['2016-02-15', '2016-02-16'], probe=1, datarate='srvy'
MMS> tplot, 'mms1_epd_feeps_electron_intensity_omni_spin'
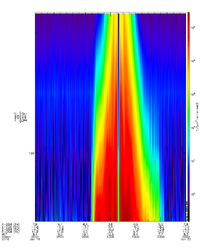
Quick Look Plots
To create EIS Quicklook Plots:
MMS> mms_load_eis_crib_qlplots
<gallery widths=300px heights=250px align="center"> EIS_QuickLook_Plots.png|MMS1 EIS Quick Look Plots, December 15, 2015 /gallery>