MMS Energetic Ion Spectrometer

SPEDAS provides command line and GUI access to the MMS EIS data.
For more information on the EPD-EIS instrument, please see the EPD Data Products Guide:
https://lasp.colorado.edu/mms/sdc/public/datasets/epd/ (EPD Data Products Guide 13Apr16 v4)
EIS Data
For more complete examples, see the EIS crib sheets located in the /projects/mms/examples/ folder.
Examples
H+ Flux
To load and plot the MMS1 EIS H+ Flux for all channels on December 15, 2015: <syntaxhighlight lang="idl"> MMS> trange=['2015-12-15', '2015-12-16']
MMS> mms_load_eis, probes=1, trange=trange, datatype='extof', level='l2'
MMS> tplot, '*_extof_proton_flux_omni_spin'
</syntaxhighlight>
-
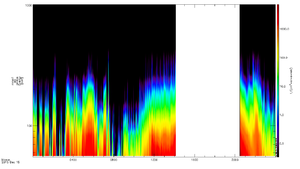
MMS1 EIS H+ Flux for all channels on December 15, 2015

He++ Flux
To load and plot the MMS1 EIS He++ Flux for all channels on December 15, 2015: <syntaxhighlight lang="idl"> MMS> mms_load_eis, probes=1, trange=['2015-12-15', '2015-12-16'], datatype='extof', level='l2'
MMS> tplot, '*extof_alpha_flux_omni_spin'
</syntaxhighlight>
-
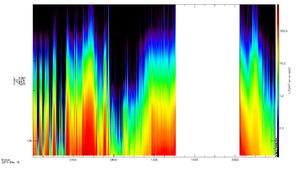
MMS1 EIS He++ Flux for all channels on December 15, 2015

Electron Data
To load and plot the MMS3 electron (electronenergy) data on December 15, 2015: <syntaxhighlight lang="idl"> MMS> mms_load_eis, probe=3, trange=['2015-12-15', '2015-12-16'], datatype='electronenergy', level='l2'
MMS> mms_eis_pad, probe=3, species='electron', datatype='electronenergy', data_units='flux', level='l2'
MMS> tplot, ['mms3_epd_eis_electronenergy_electron_flux_omni_spin']
</syntaxhighlight>
-
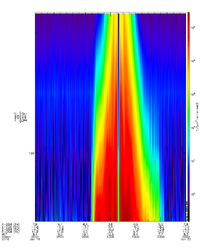
MMS3 EIS Electron Energy December 15, 2015

Burst Data
To load and plot the MMS1 EIS electron data on December 15, 2015: <syntaxhighlight lang="idl"> MMS> mms_load_eis, probe=1, trange=['2015-12-15', '2015-12-16'], datatype='extof', data_rate='brst', level='l2'
MMS> mms_eis_pad, probe=1, trange=['2015-12-15', '2015-12-16'], datatype='extof', species='ion', data_rate='brst', level='l2'
MMS> tdegap, 'mms1_epd_eis_brst_extof_*keV_proton_flux_omni_pad_spin', /overwrite
MMS> tplot, 'mms1'+['_epd_eis_brst_extof_proton_flux_omni_spin', '_epd_eis_brst_extof_*keV_proton_flux_omni_pad_spin']
MMS> tlimit, ['2015-12-15/10:55', '2015-12-15/11:30']
</syntaxhighlight>
-
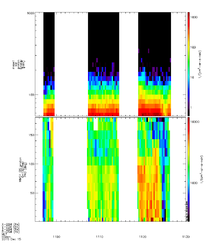
MMS1 EIS Burst Mode Data December 15, 2015

Quick Look Plots
To create EIS Quicklook Plots: <syntaxhighlight lang="idl"> MMS> .run mms_load_eis_crib_qlplots
</syntaxhighlight>
-
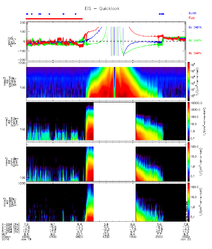
MMS1 EIS Quick Look Plots December 15, 2015