File list
Jump to navigation
Jump to search
This special page shows all uploaded files.
| Date | Name | Thumbnail | Size | User | Description | Versions |
|---|---|---|---|---|---|---|
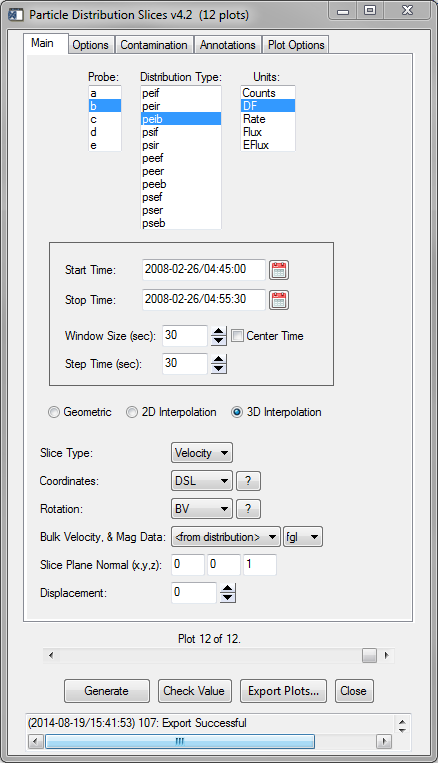
| 23:38, 19 August 2014 | Thm slice2d gui.PNG (file) |  |
39 KB | Floresaa | Graphical interface for generating and plotting particle distribution slices. | 1 |
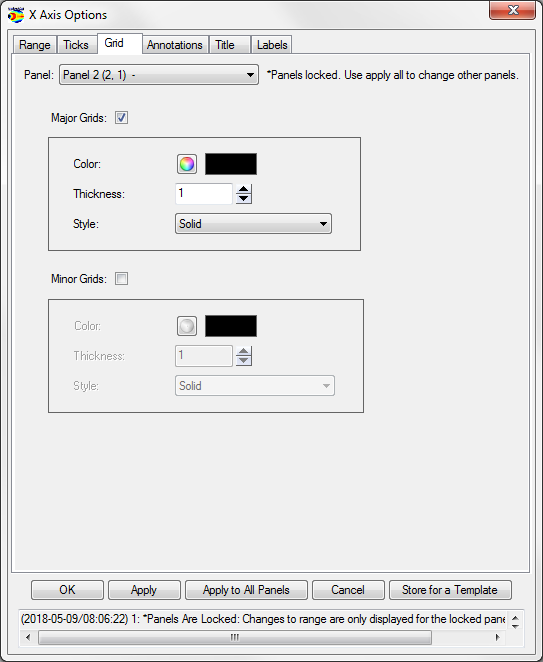
| 15:25, 9 May 2018 | 3.6.10a.png (file) |  |
40 KB | Clrussell | 2 | |
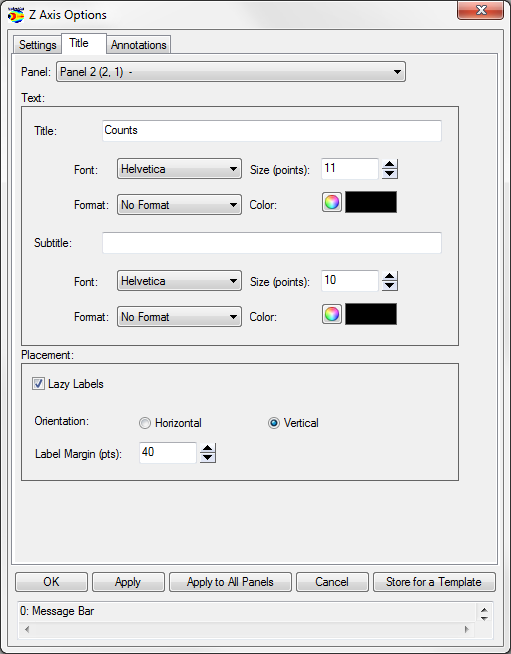
| 15:12, 9 May 2018 | 3.6.7.png (file) |  |
40 KB | Clrussell | 2 | |
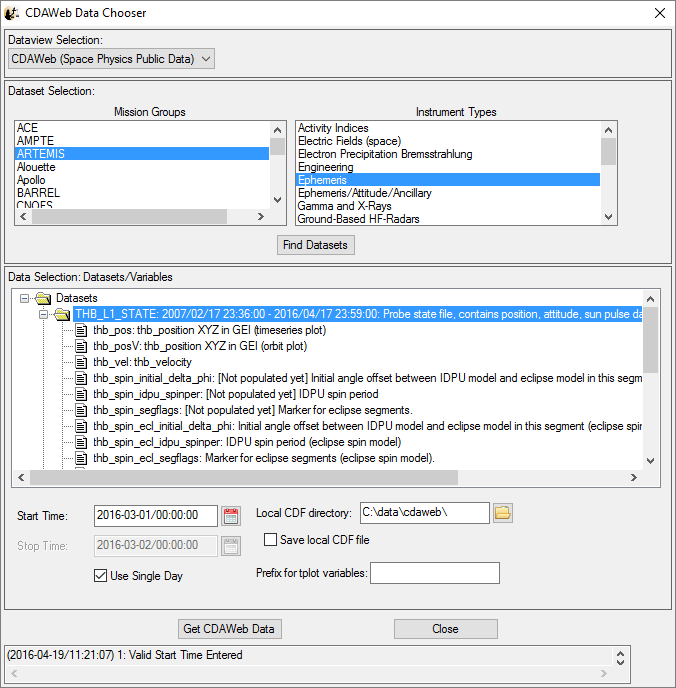
| 18:33, 19 April 2016 | Load data cdaweb 2.png (file) |  |
41 KB | Nikos | Load Data using CDAWeb | 1 |
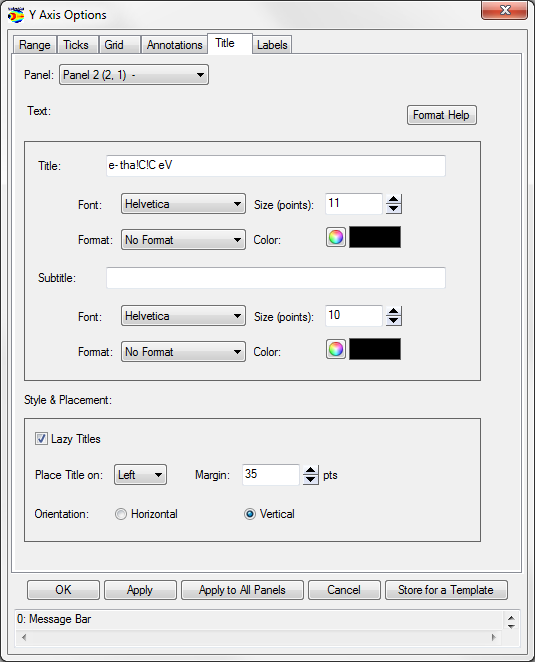
| 15:33, 9 May 2018 | 3.6.9b.png (file) |  |
41 KB | Clrussell | Reverted to version as of 15:29, 9 May 2018 | 6 |
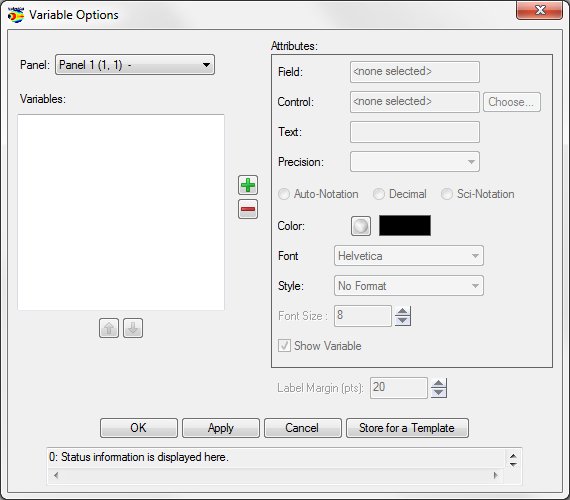
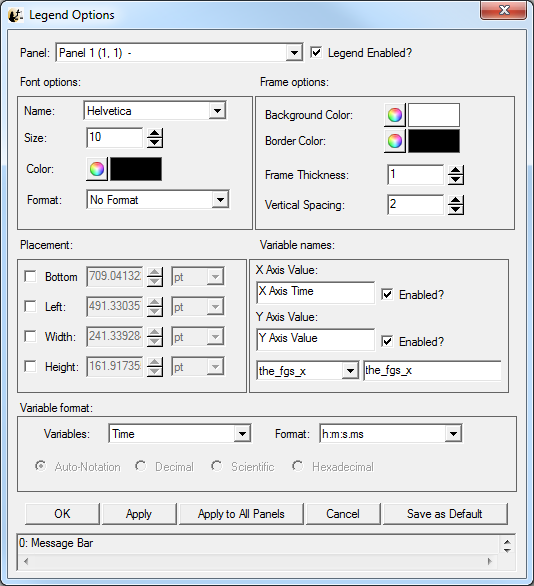
| 21:54, 27 February 2014 | Legend options.png (file) |  |
41 KB | Egrimes | Legend Options | 1 |
| 15:14, 9 May 2018 | 3.6.8c.png (file) |  |
42 KB | Clrussell | 2 | |
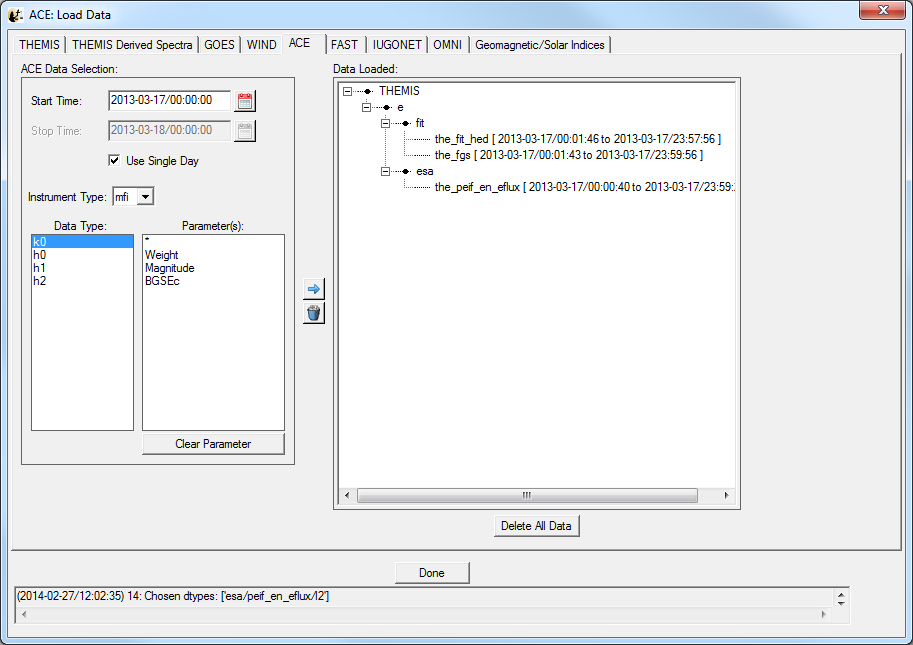
| 21:38, 27 February 2014 | Load ace data.png (file) |  |
44 KB | Egrimes | Load ACE data | 1 |
| 15:22, 9 May 2018 | 3.6.8f.png (file) |  |
45 KB | Clrussell | 2 | |
| 15:22, 9 May 2018 | 3.6.8g.png (file) |  |
45 KB | Clrussell | 2 | |
| 20:56, 8 October 2018 | Screen Shot 2018-10-05 at 5.01.03 PM.png (file) |  |
46 KB | Egrimes | 1 | |
| 15:13, 9 May 2018 | 3.6.8a.png (file) |  |
47 KB | Clrussell | 2 | |
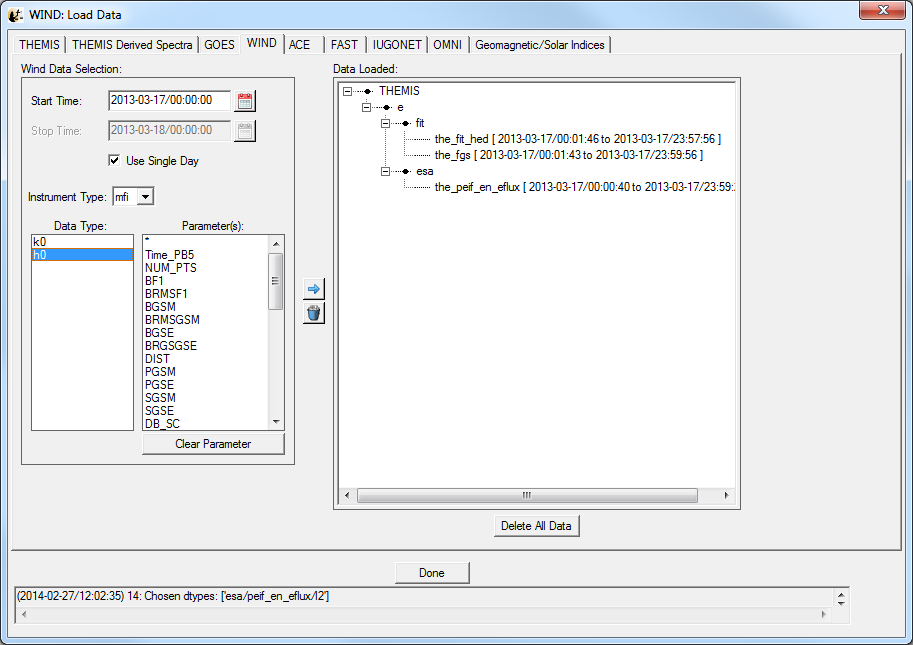
| 21:36, 27 February 2014 | Load wind data.png (file) |  |
48 KB | Egrimes | Load WIND data | 1 |
| 23:50, 25 March 2022 | High dpi settings.PNG (file) |  |
48 KB | Jwl | High DPI settings under Windows Compatibility settings | 1 |
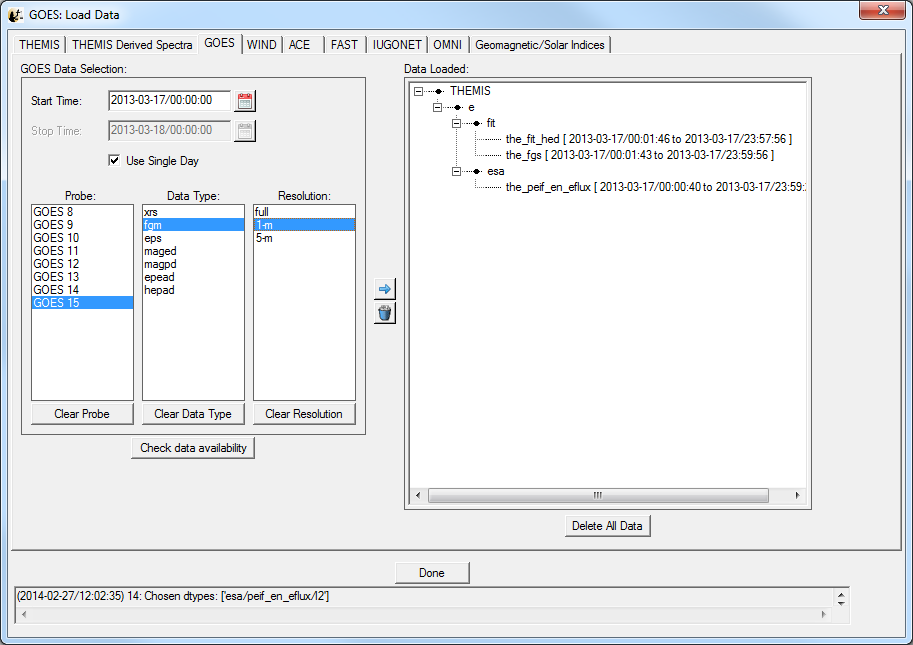
| 21:36, 27 February 2014 | Load goes data.png (file) |  |
48 KB | Egrimes | Load GOES data | 1 |
| 01:30, 27 March 2018 | Test themis sst.png (file) |  |
49 KB | Adrozdov | Screenshot of introductory example Test_themis_sst | 1 |
| 18:27, 30 April 2018 | About-plugin.png (file) |  |
49 KB | Egrimes | 1 | |
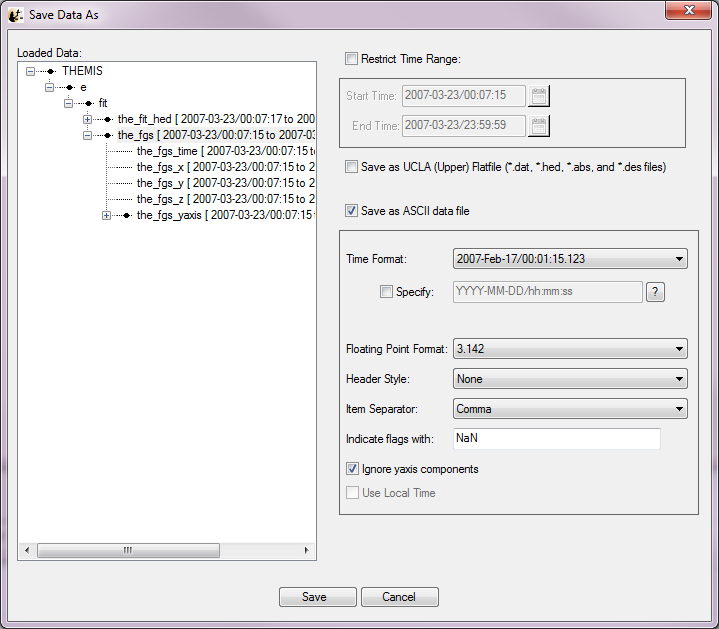
| 20:11, 18 August 2014 | Save data as.png (file) |  |
49 KB | Egrimes | SPEDAS save data as | 1 |
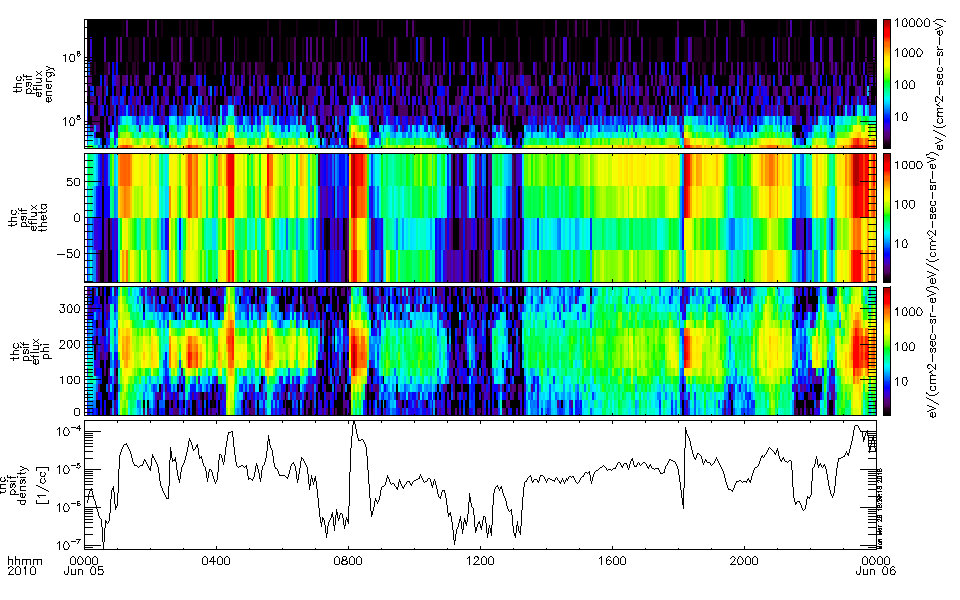
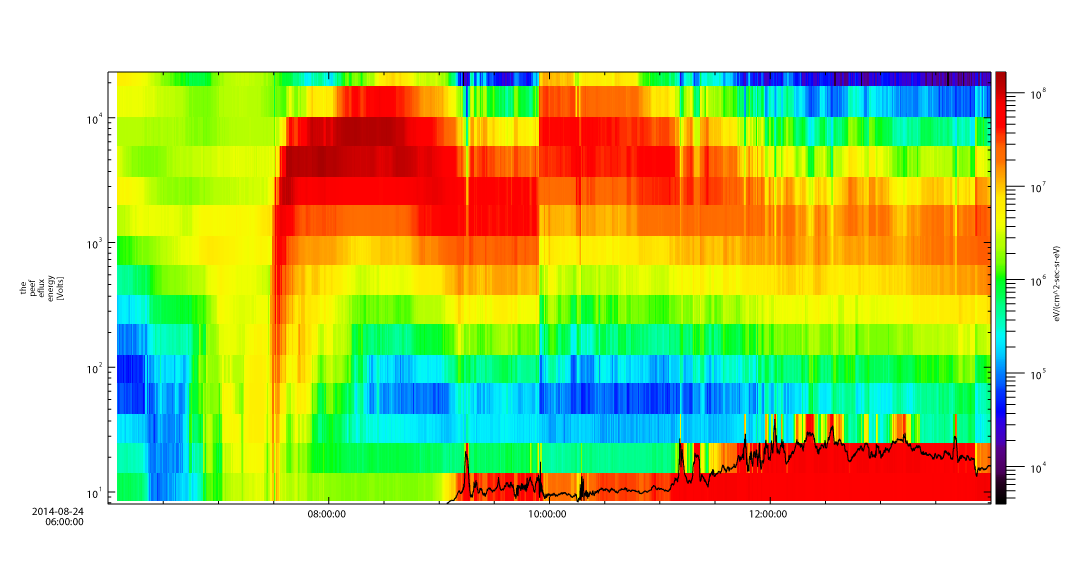
| 00:24, 30 August 2014 | Espec pot.png (file) |  |
50 KB | Floresaa | Energy spectrogram of ESA electron data with overlaid spacecraft potential. | 1 |
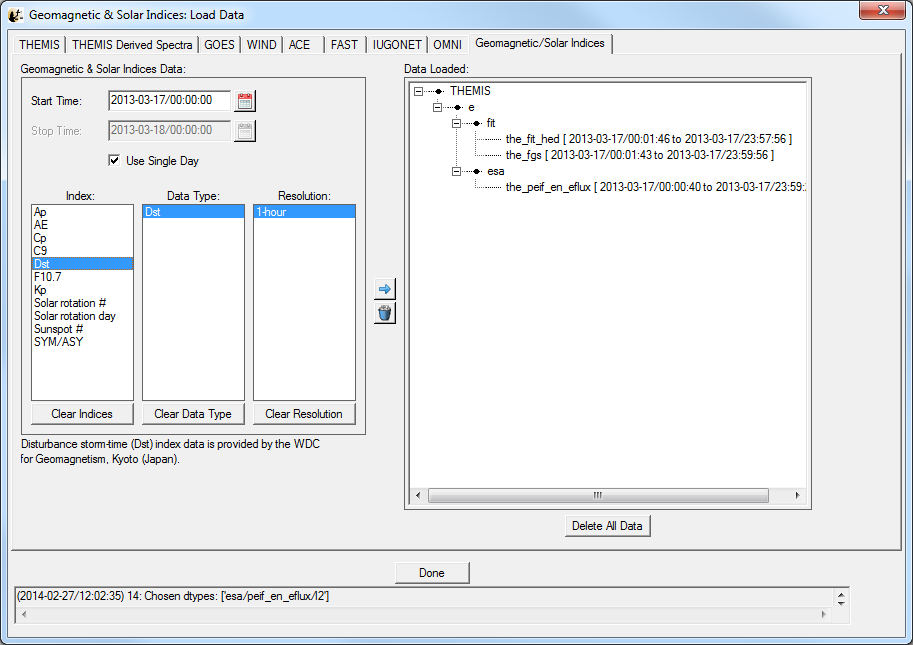
| 21:43, 27 February 2014 | Load geomag indices data.png (file) |  |
50 KB | Egrimes | Load geomagnetic indices data | 1 |
| 15:14, 9 May 2018 | 3.6.8b.png (file) |  |
50 KB | Clrussell | 2 | |
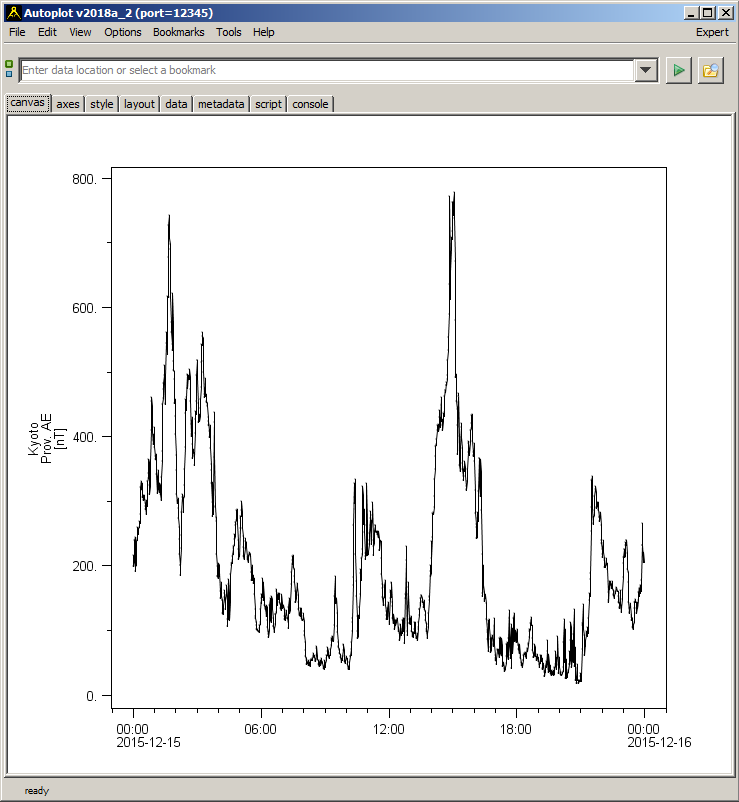
| 16:37, 14 May 2018 | Ae tplot variable in autoplot.png (file) |  |
51 KB | Egrimes | 1 | |
| 15:21, 9 May 2018 | 3.6.8d.png (file) |  |
51 KB | Clrussell | 2 | |
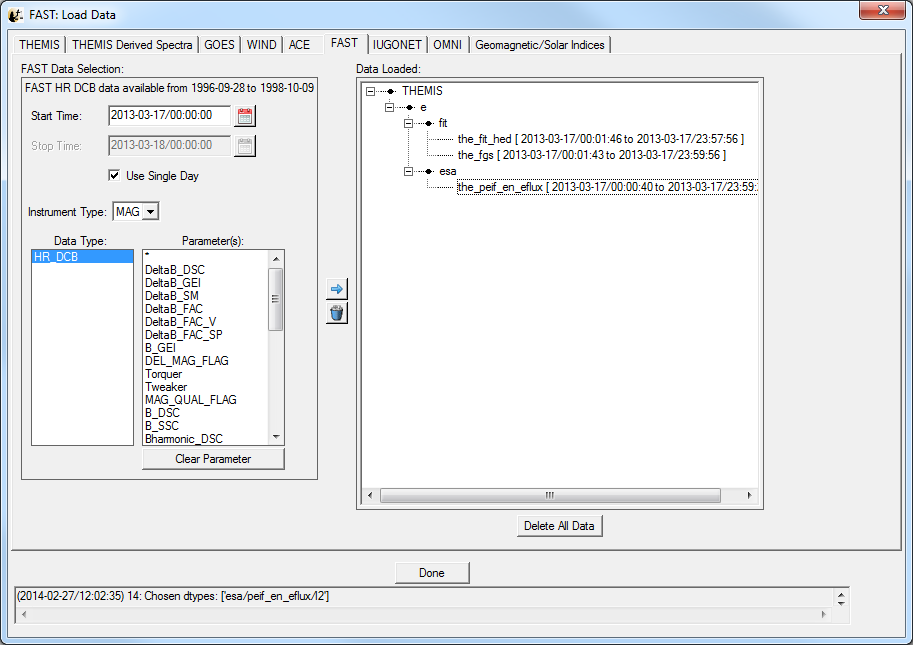
| 21:39, 27 February 2014 | Load fast data.png (file) |  |
52 KB | Egrimes | Load FAST data | 1 |
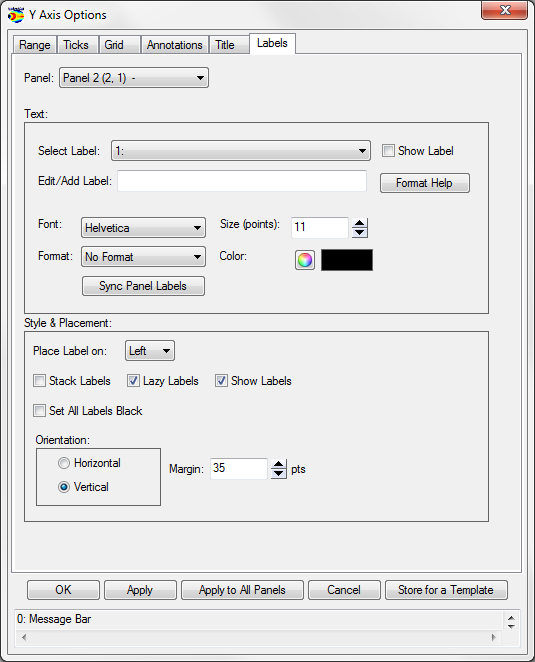
| 15:23, 9 May 2018 | 3.6.9a.png (file) |  |
52 KB | Clrussell | 2 | |
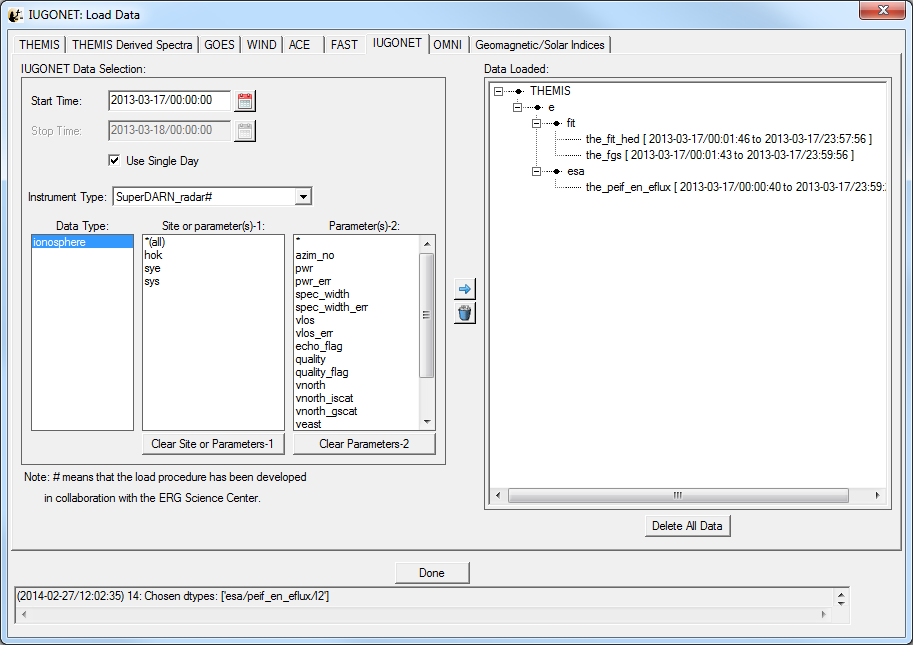
| 21:40, 27 February 2014 | Load iugonet data.png (file) |  |
53 KB | Egrimes | Load IUGONET data | 1 |
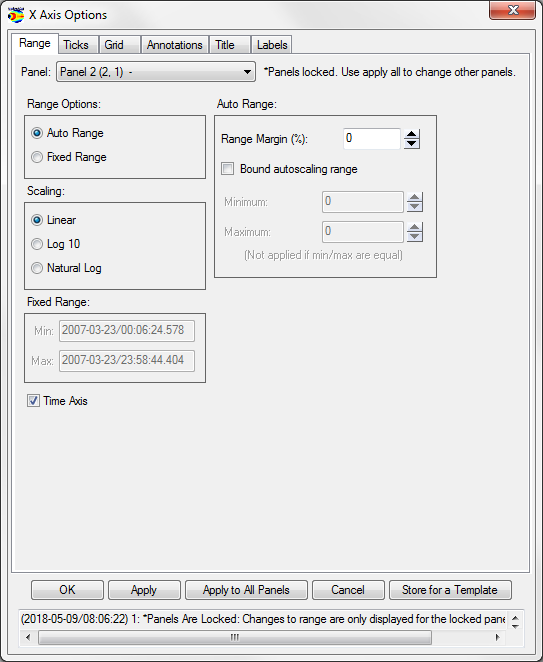
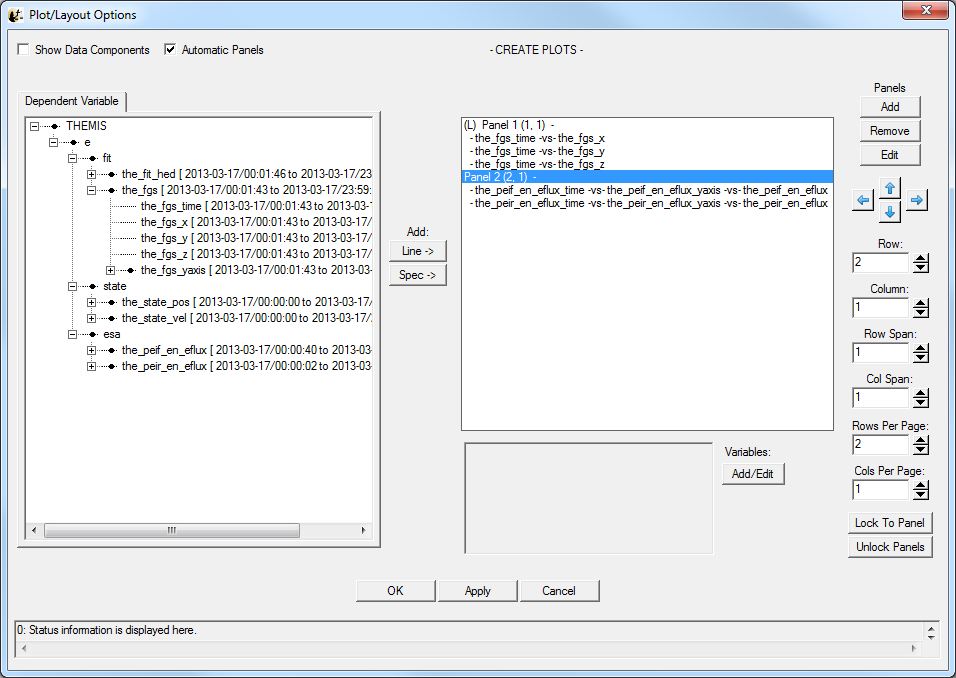
| 19:39, 14 April 2016 | 3.6.4a.png (file) |  |
55 KB | Nikos | Plot/Layout Options | 1 |
| 21:34, 27 February 2014 | Load themis spectra.png (file) |  |
57 KB | Egrimes | Load THEMIS particle spectra | 1 |
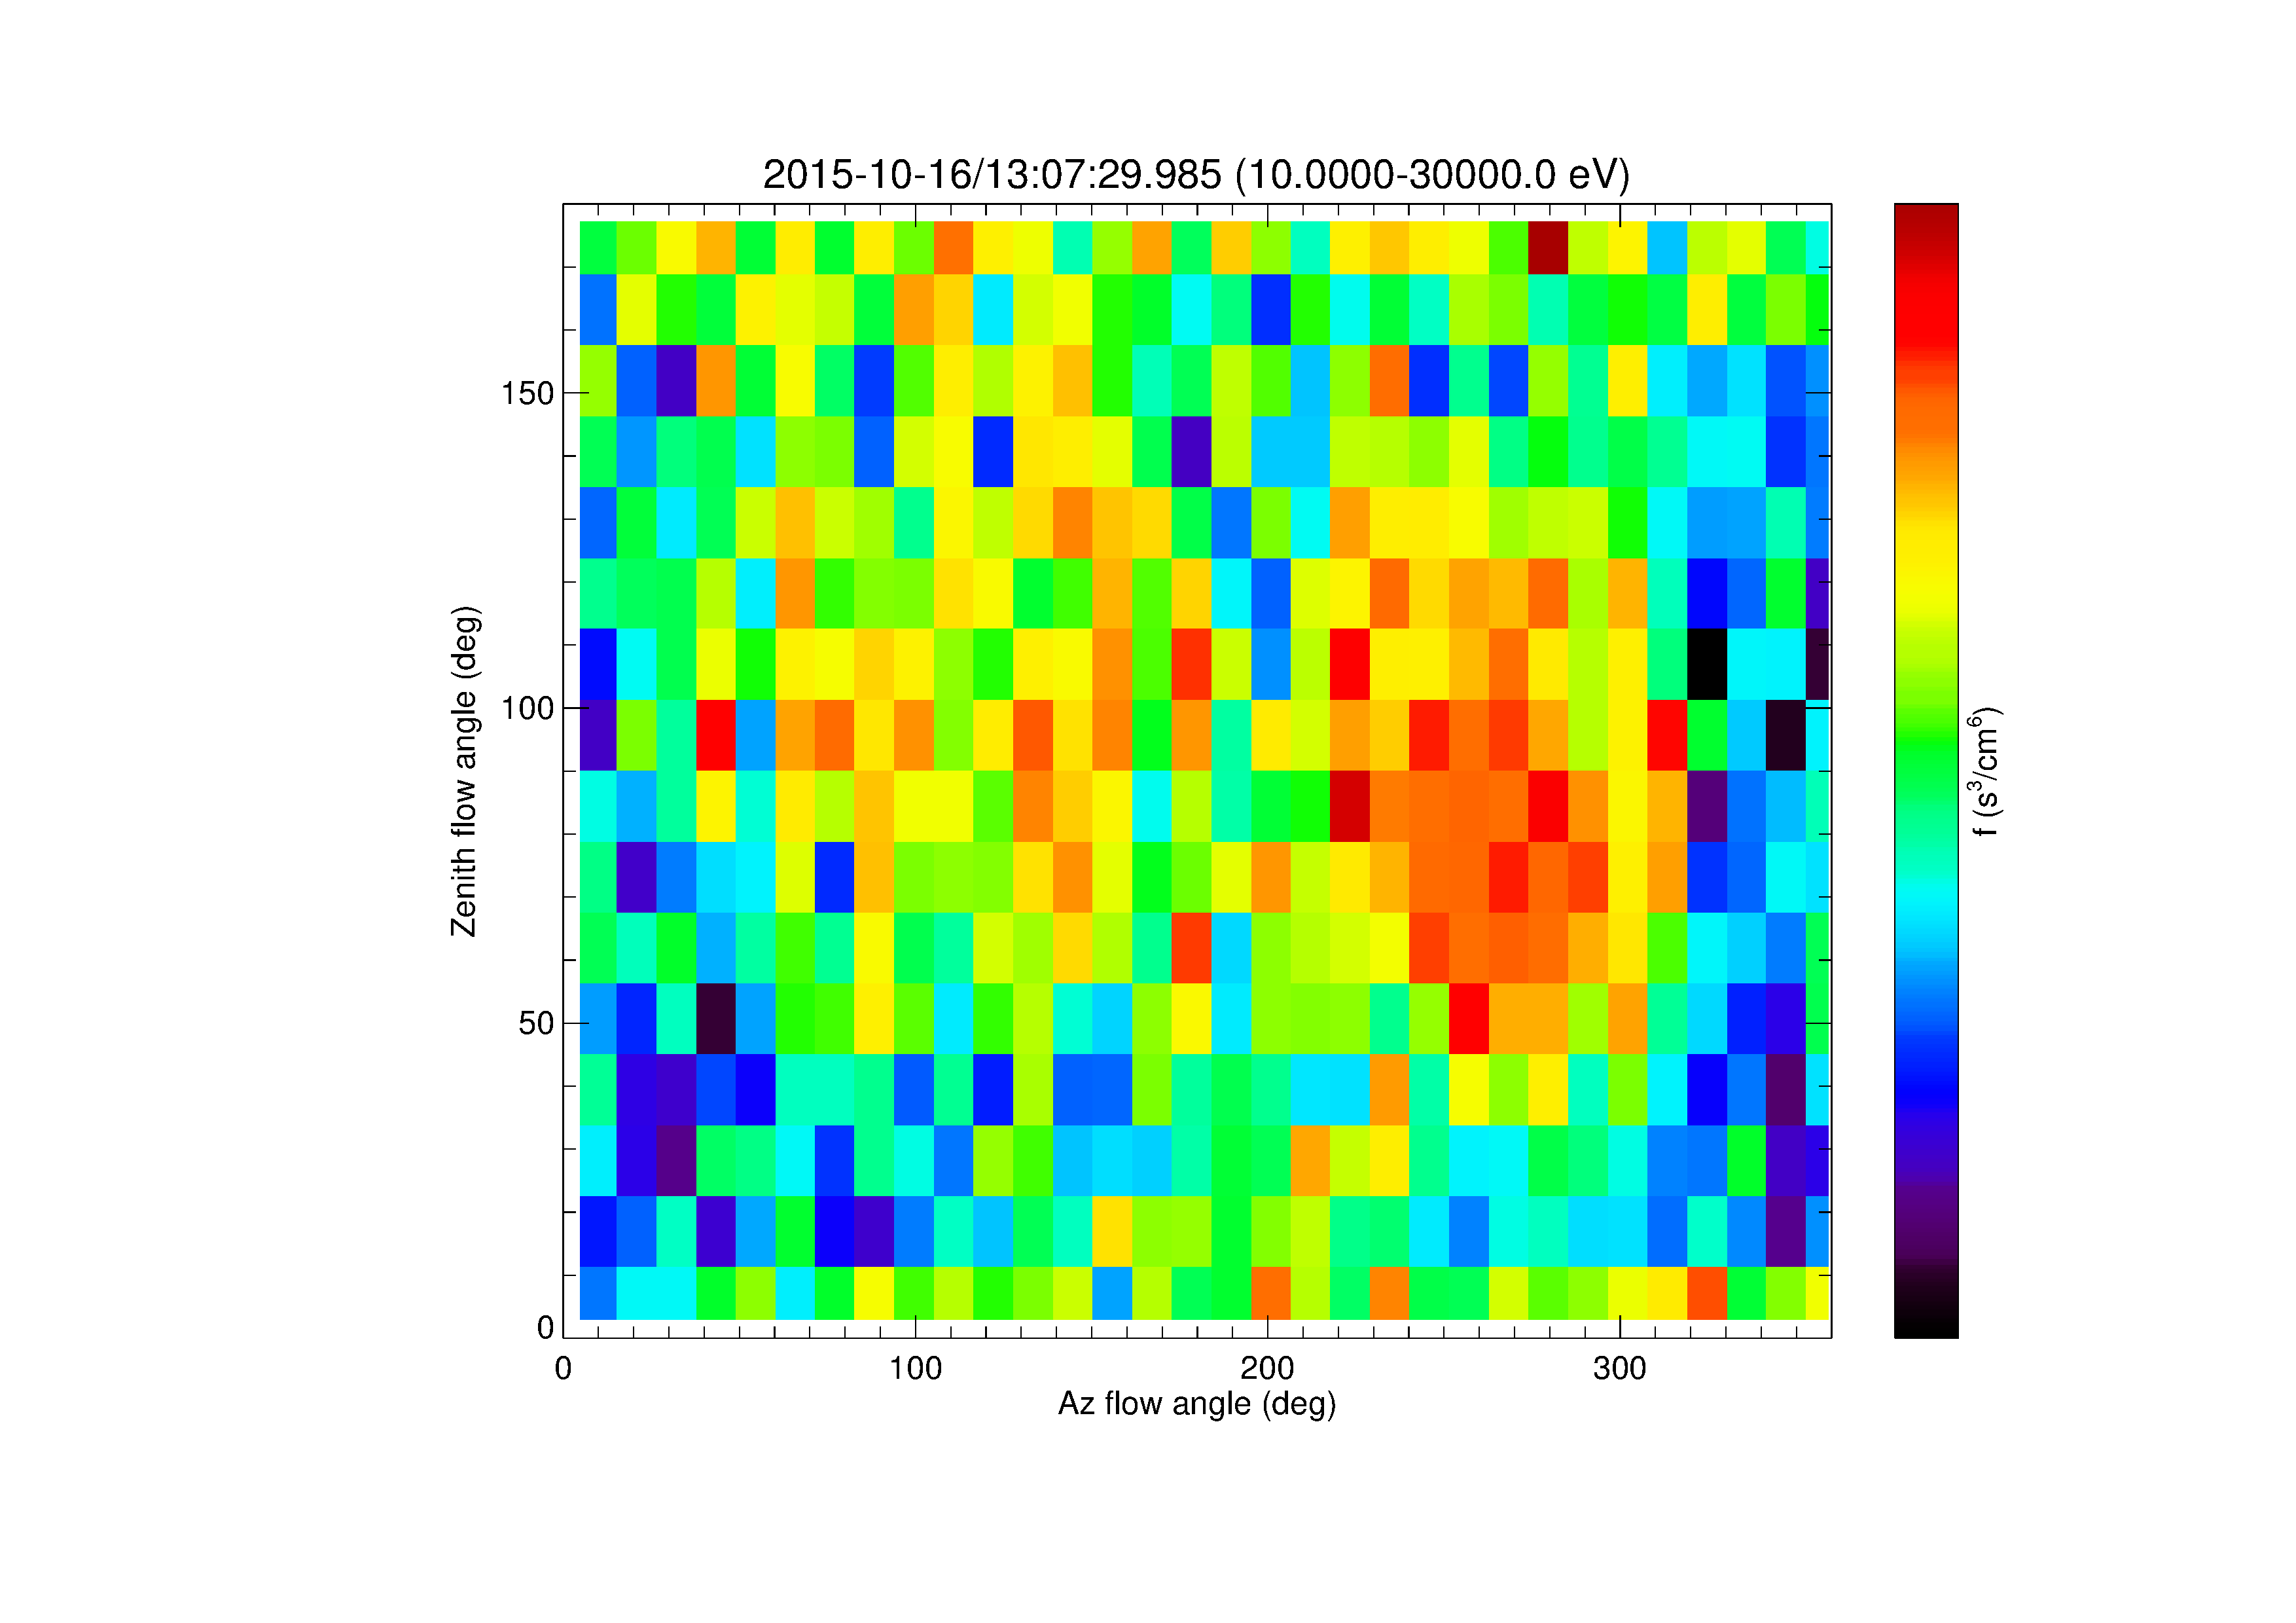
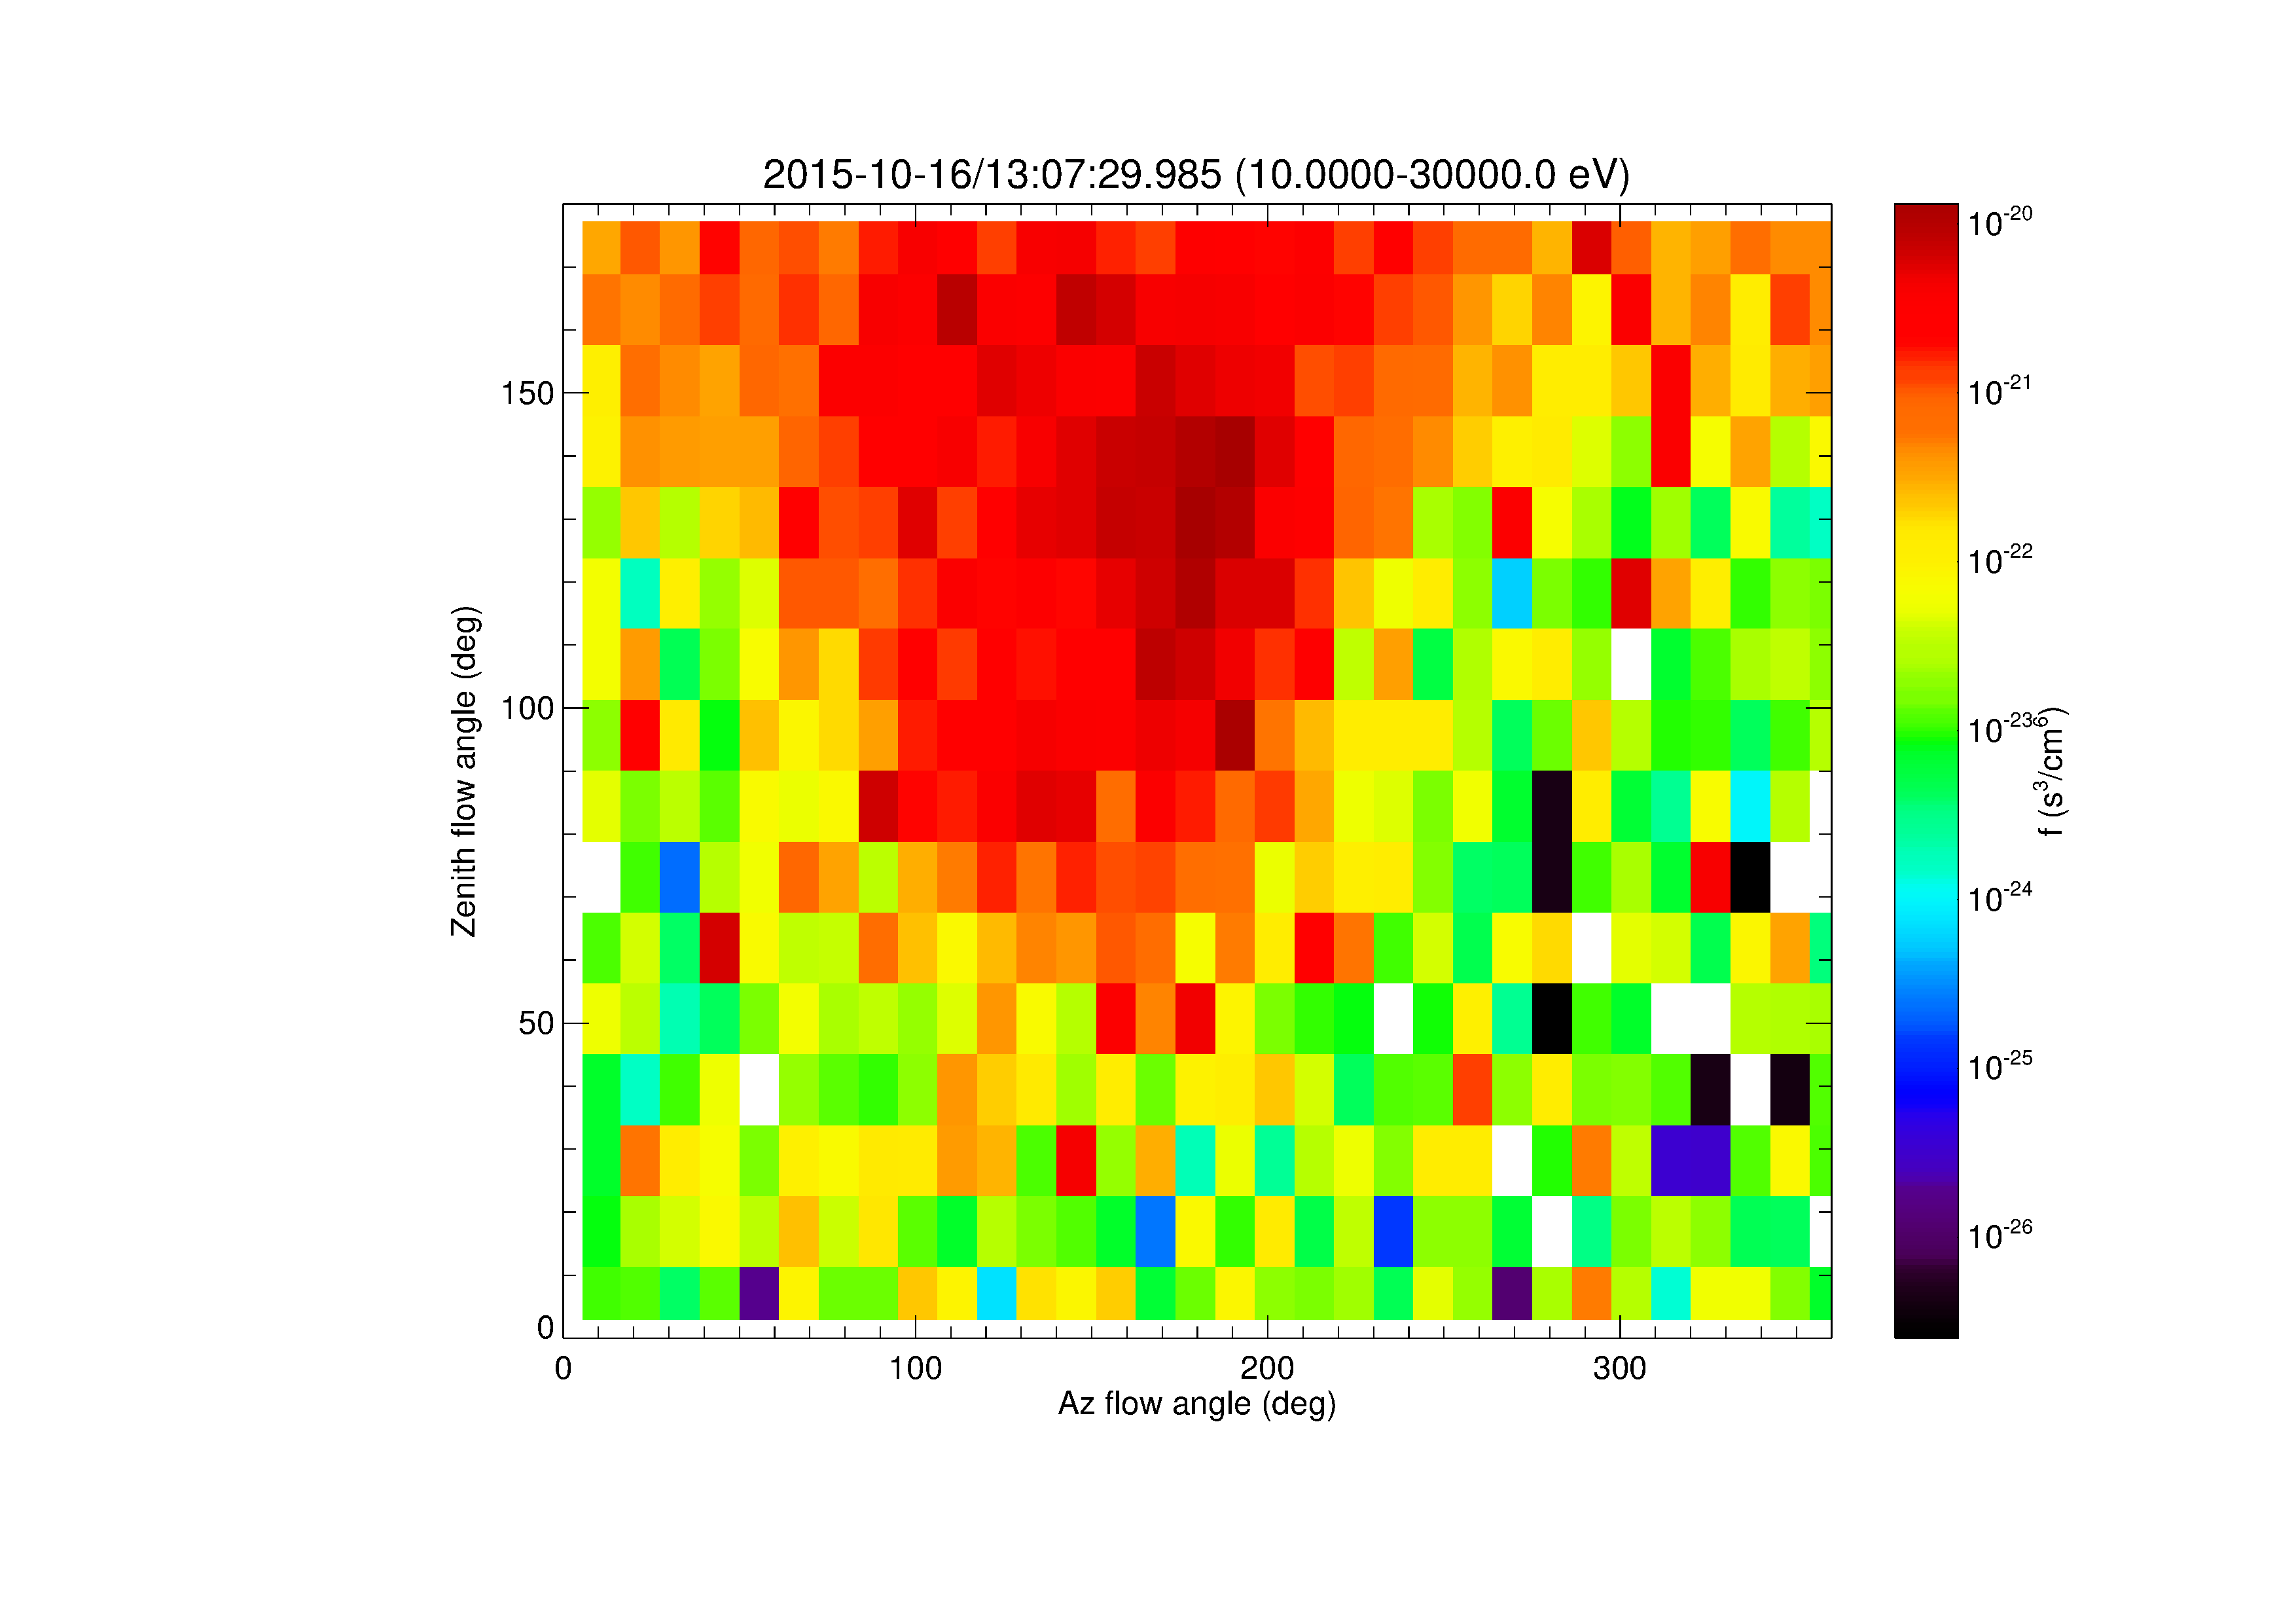
| 16:20, 18 May 2017 | Azimuth vs zenith.png (file) |  |
57 KB | Egrimes | 1 | |
| 16:39, 18 May 2017 | Azimuth vs zenith electrons.png (file) |  |
57 KB | Egrimes | 1 | |
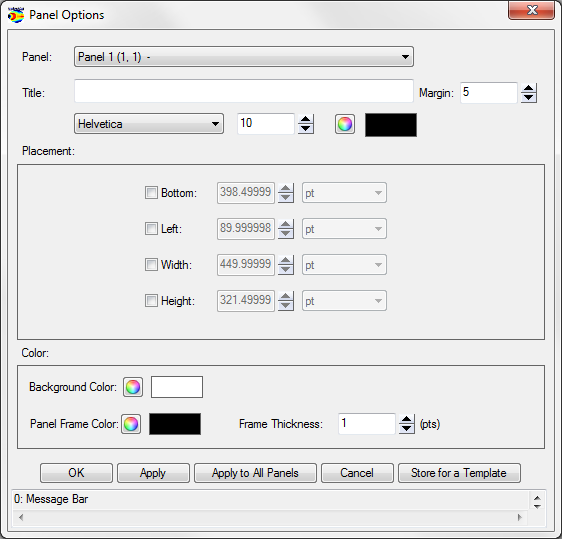
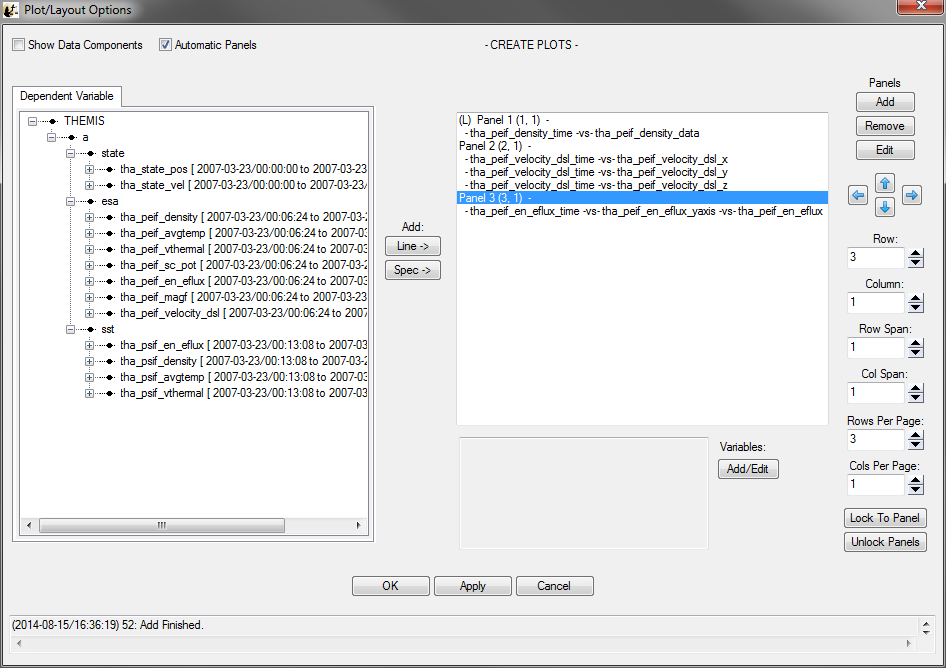
| 21:52, 27 February 2014 | Plot layout options.png (file) |  |
57 KB | Egrimes | Plot/Layout Options | 1 |
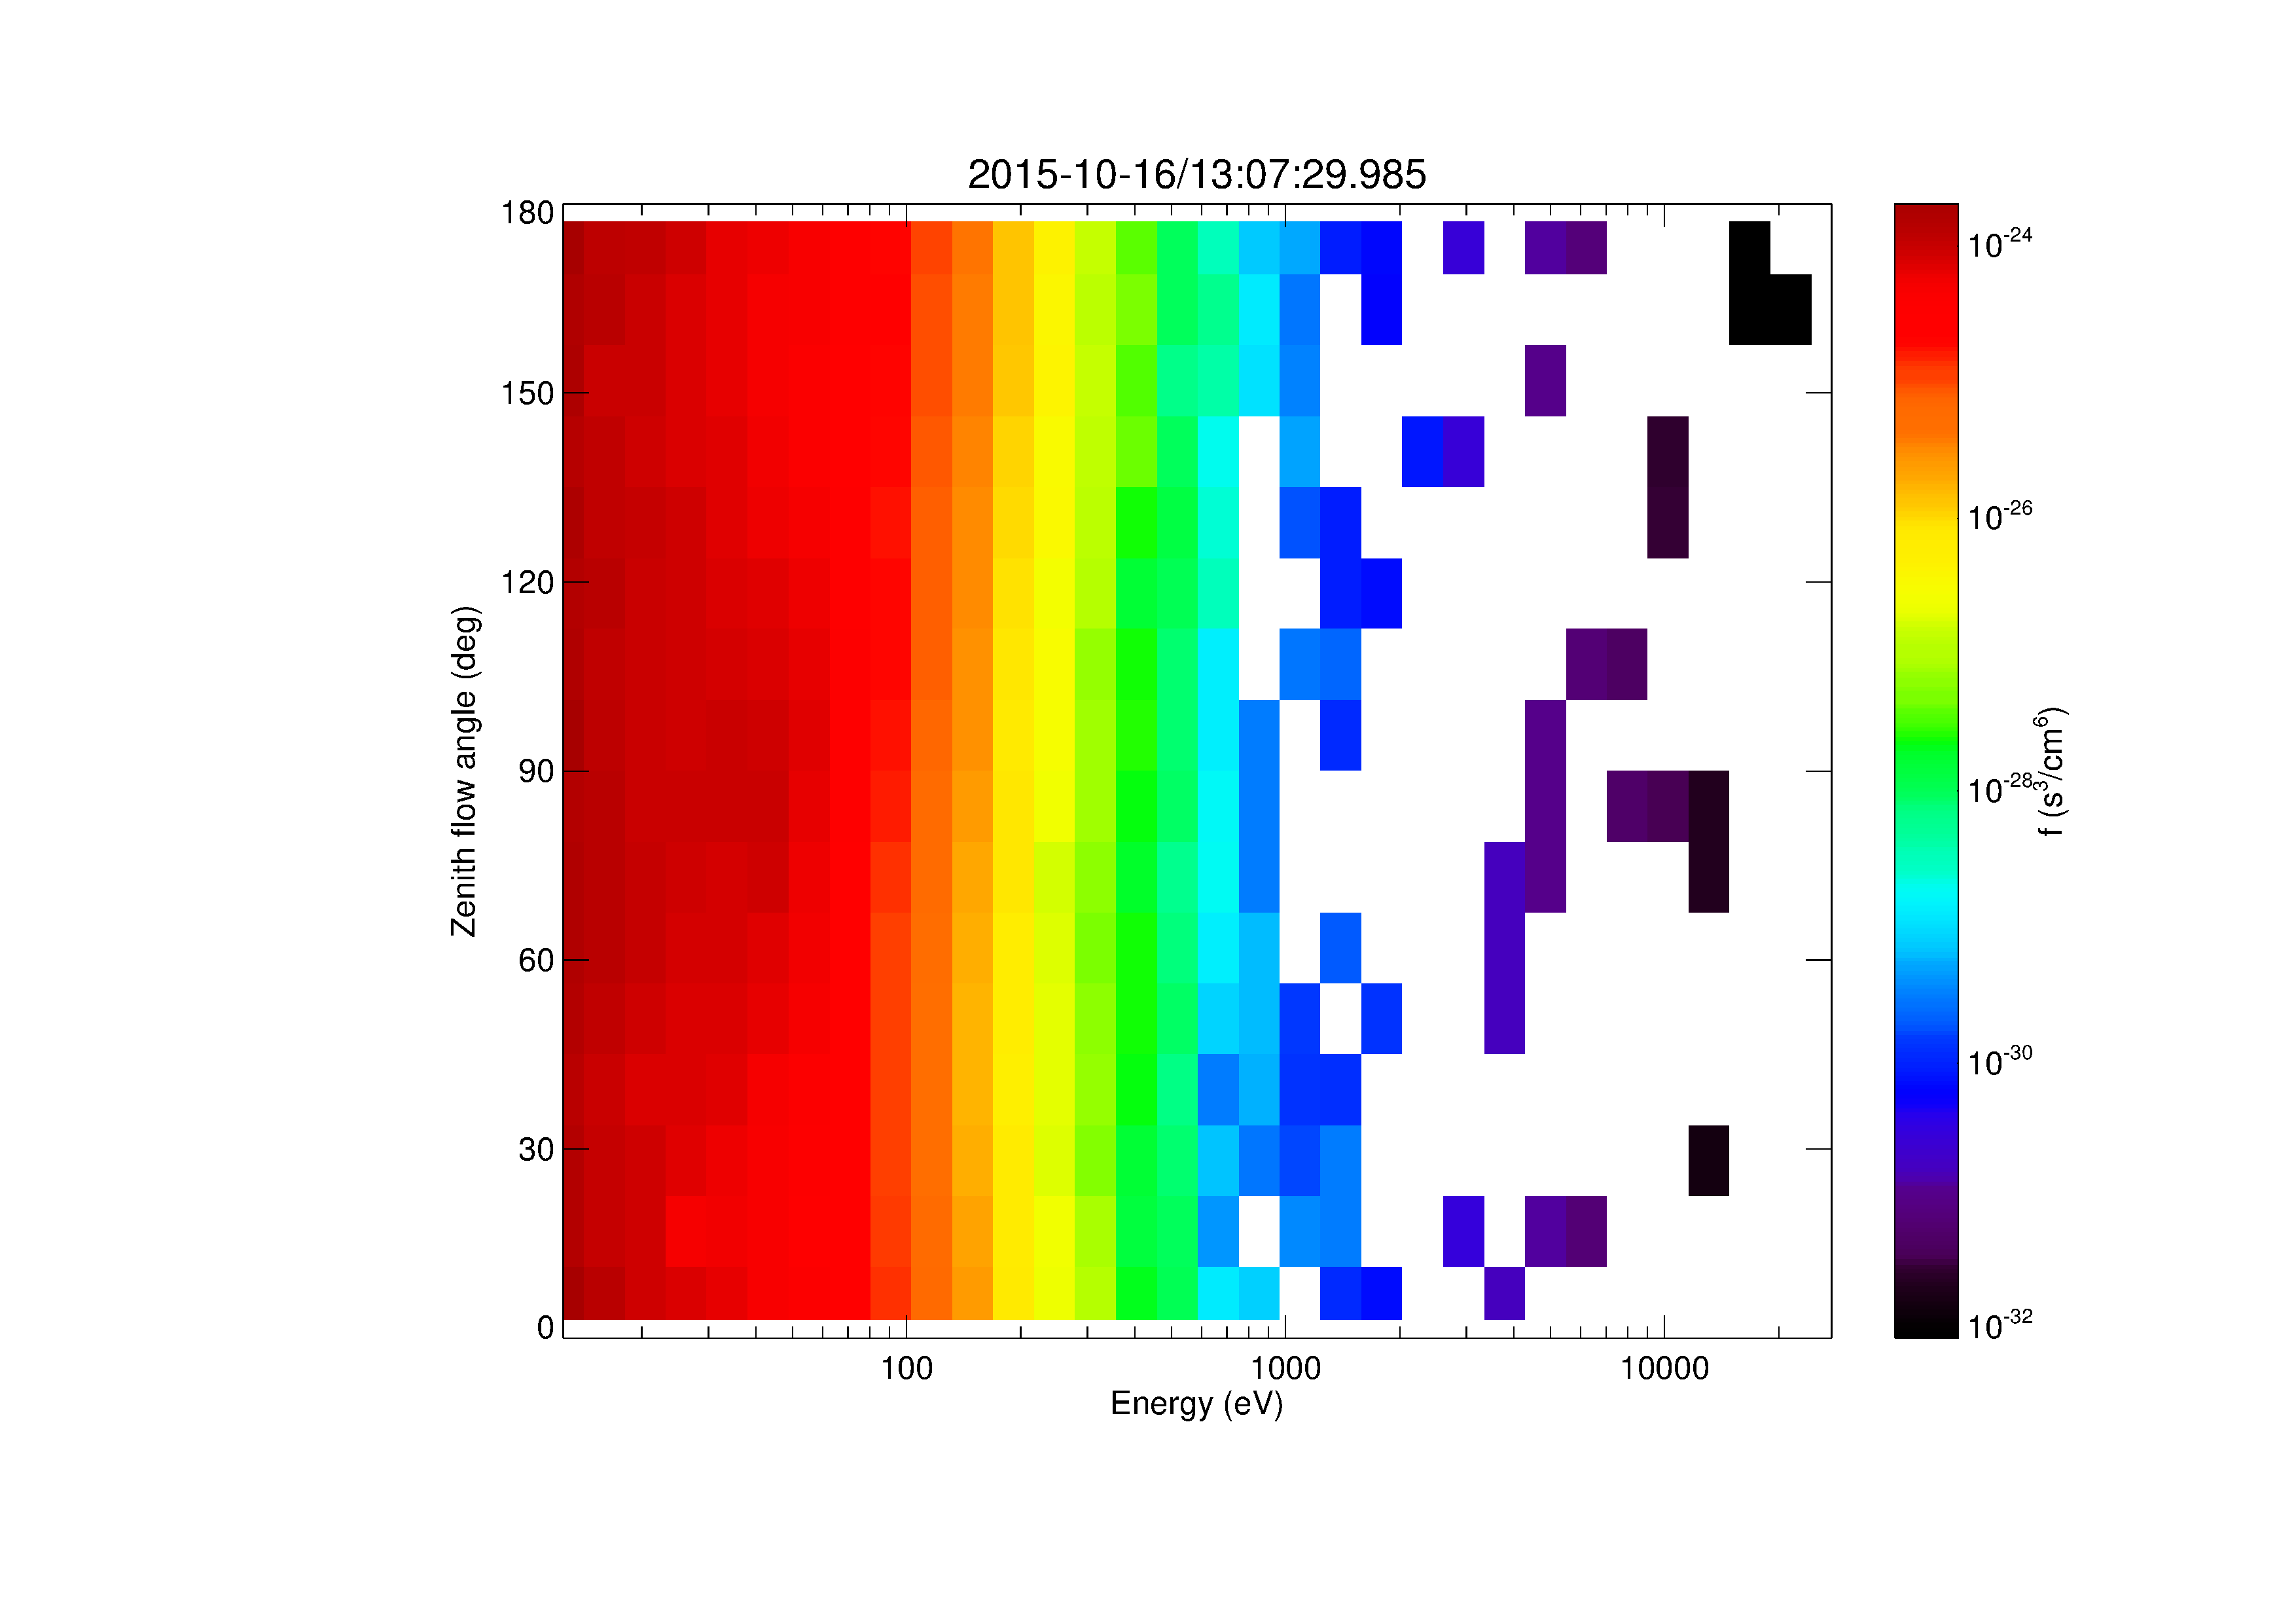
| 16:21, 18 May 2017 | Zenith vs energy.png (file) |  |
58 KB | Egrimes | 1 | |
| 16:39, 18 May 2017 | Zenith vs energy electrons.png (file) |  |
58 KB | Egrimes | 1 | |
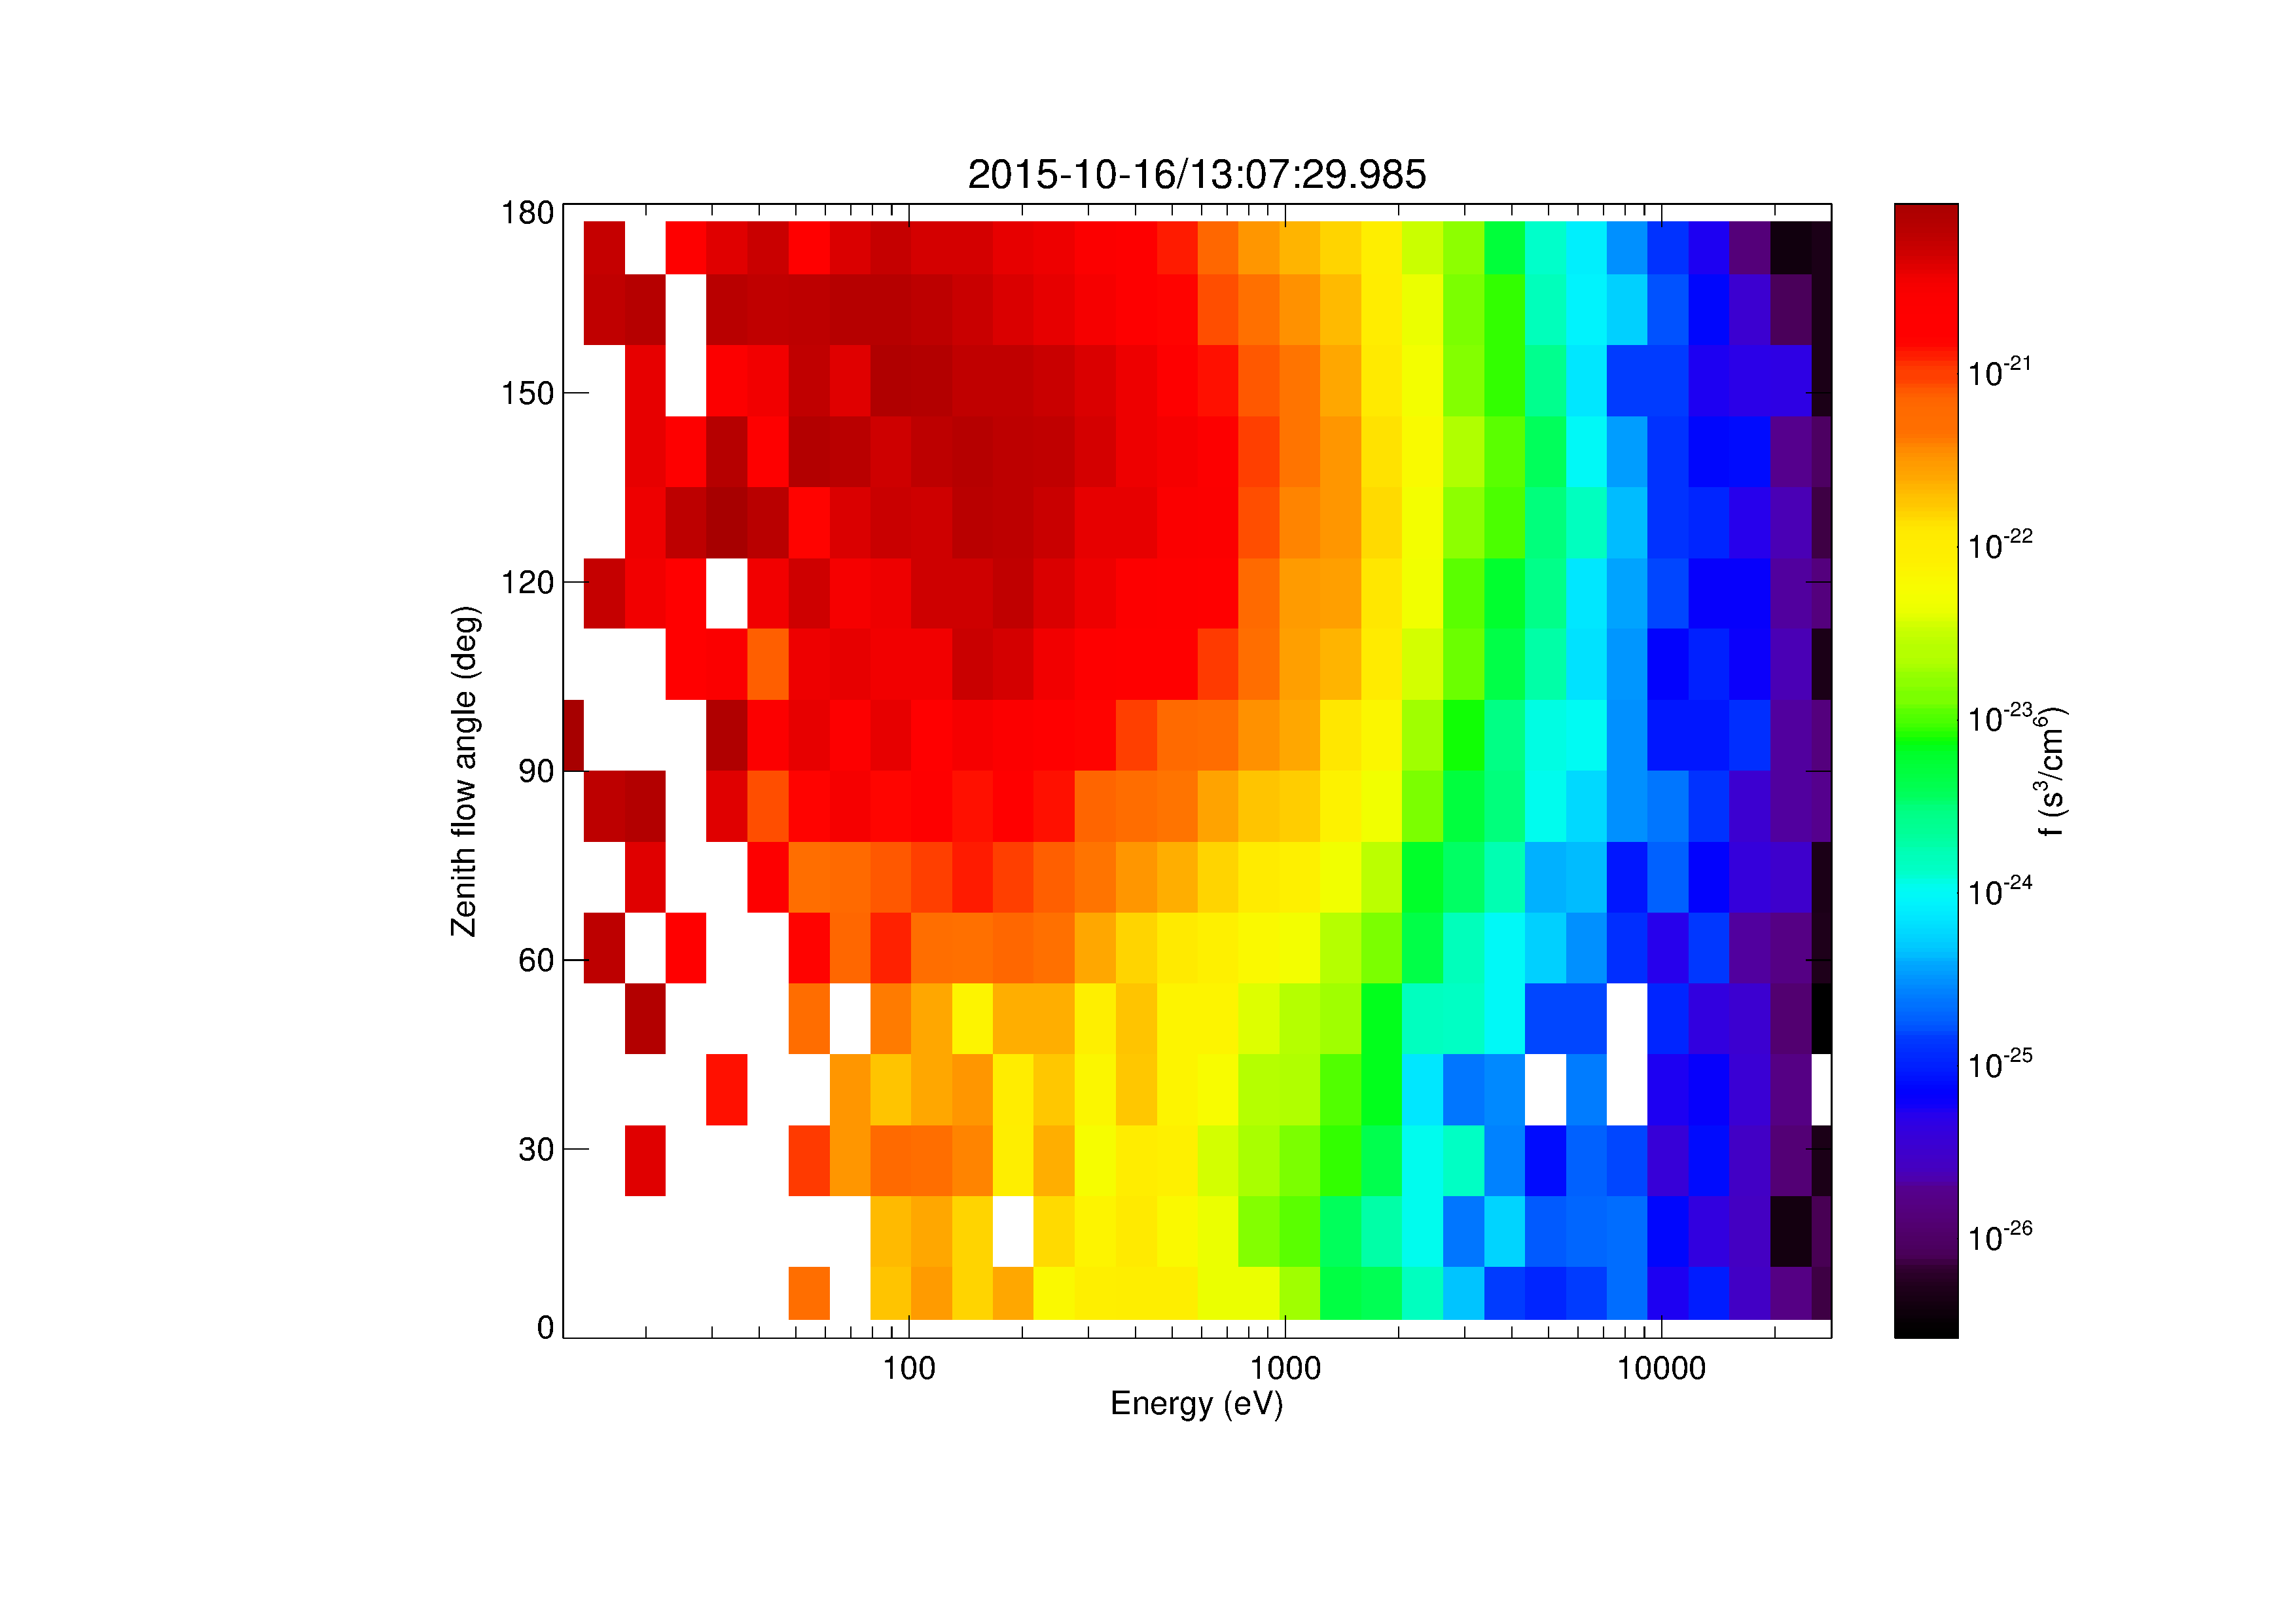
| 16:40, 18 May 2017 | Zenith vs energy ions.png (file) |  |
58 KB | Egrimes | 1 | |
| 15:52, 17 May 2017 | Ions zenith vs energy.png (file) |  |
58 KB | Egrimes | 1 | |
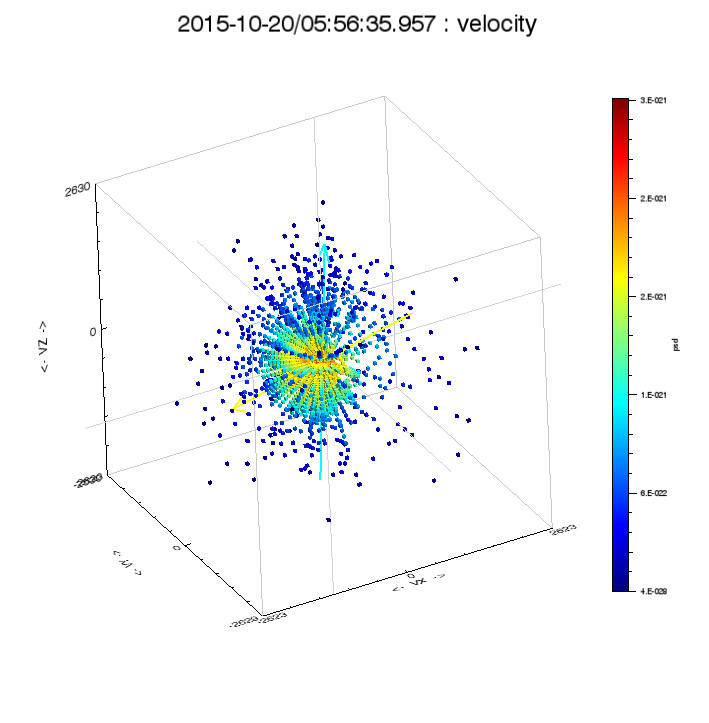
| 00:04, 12 March 2016 | Mms fpi scatter.png (file) |  |
59 KB | Floresaa | Single three-dimensional MMS FPI ion distribution with orignal (non-interpolated) data points plotted. | 1 |
| 23:49, 25 March 2022 | Idl props compatibility.PNG (file) |  |
60 KB | Jwl | Windows settings dialog for program compatibility settings | 1 |
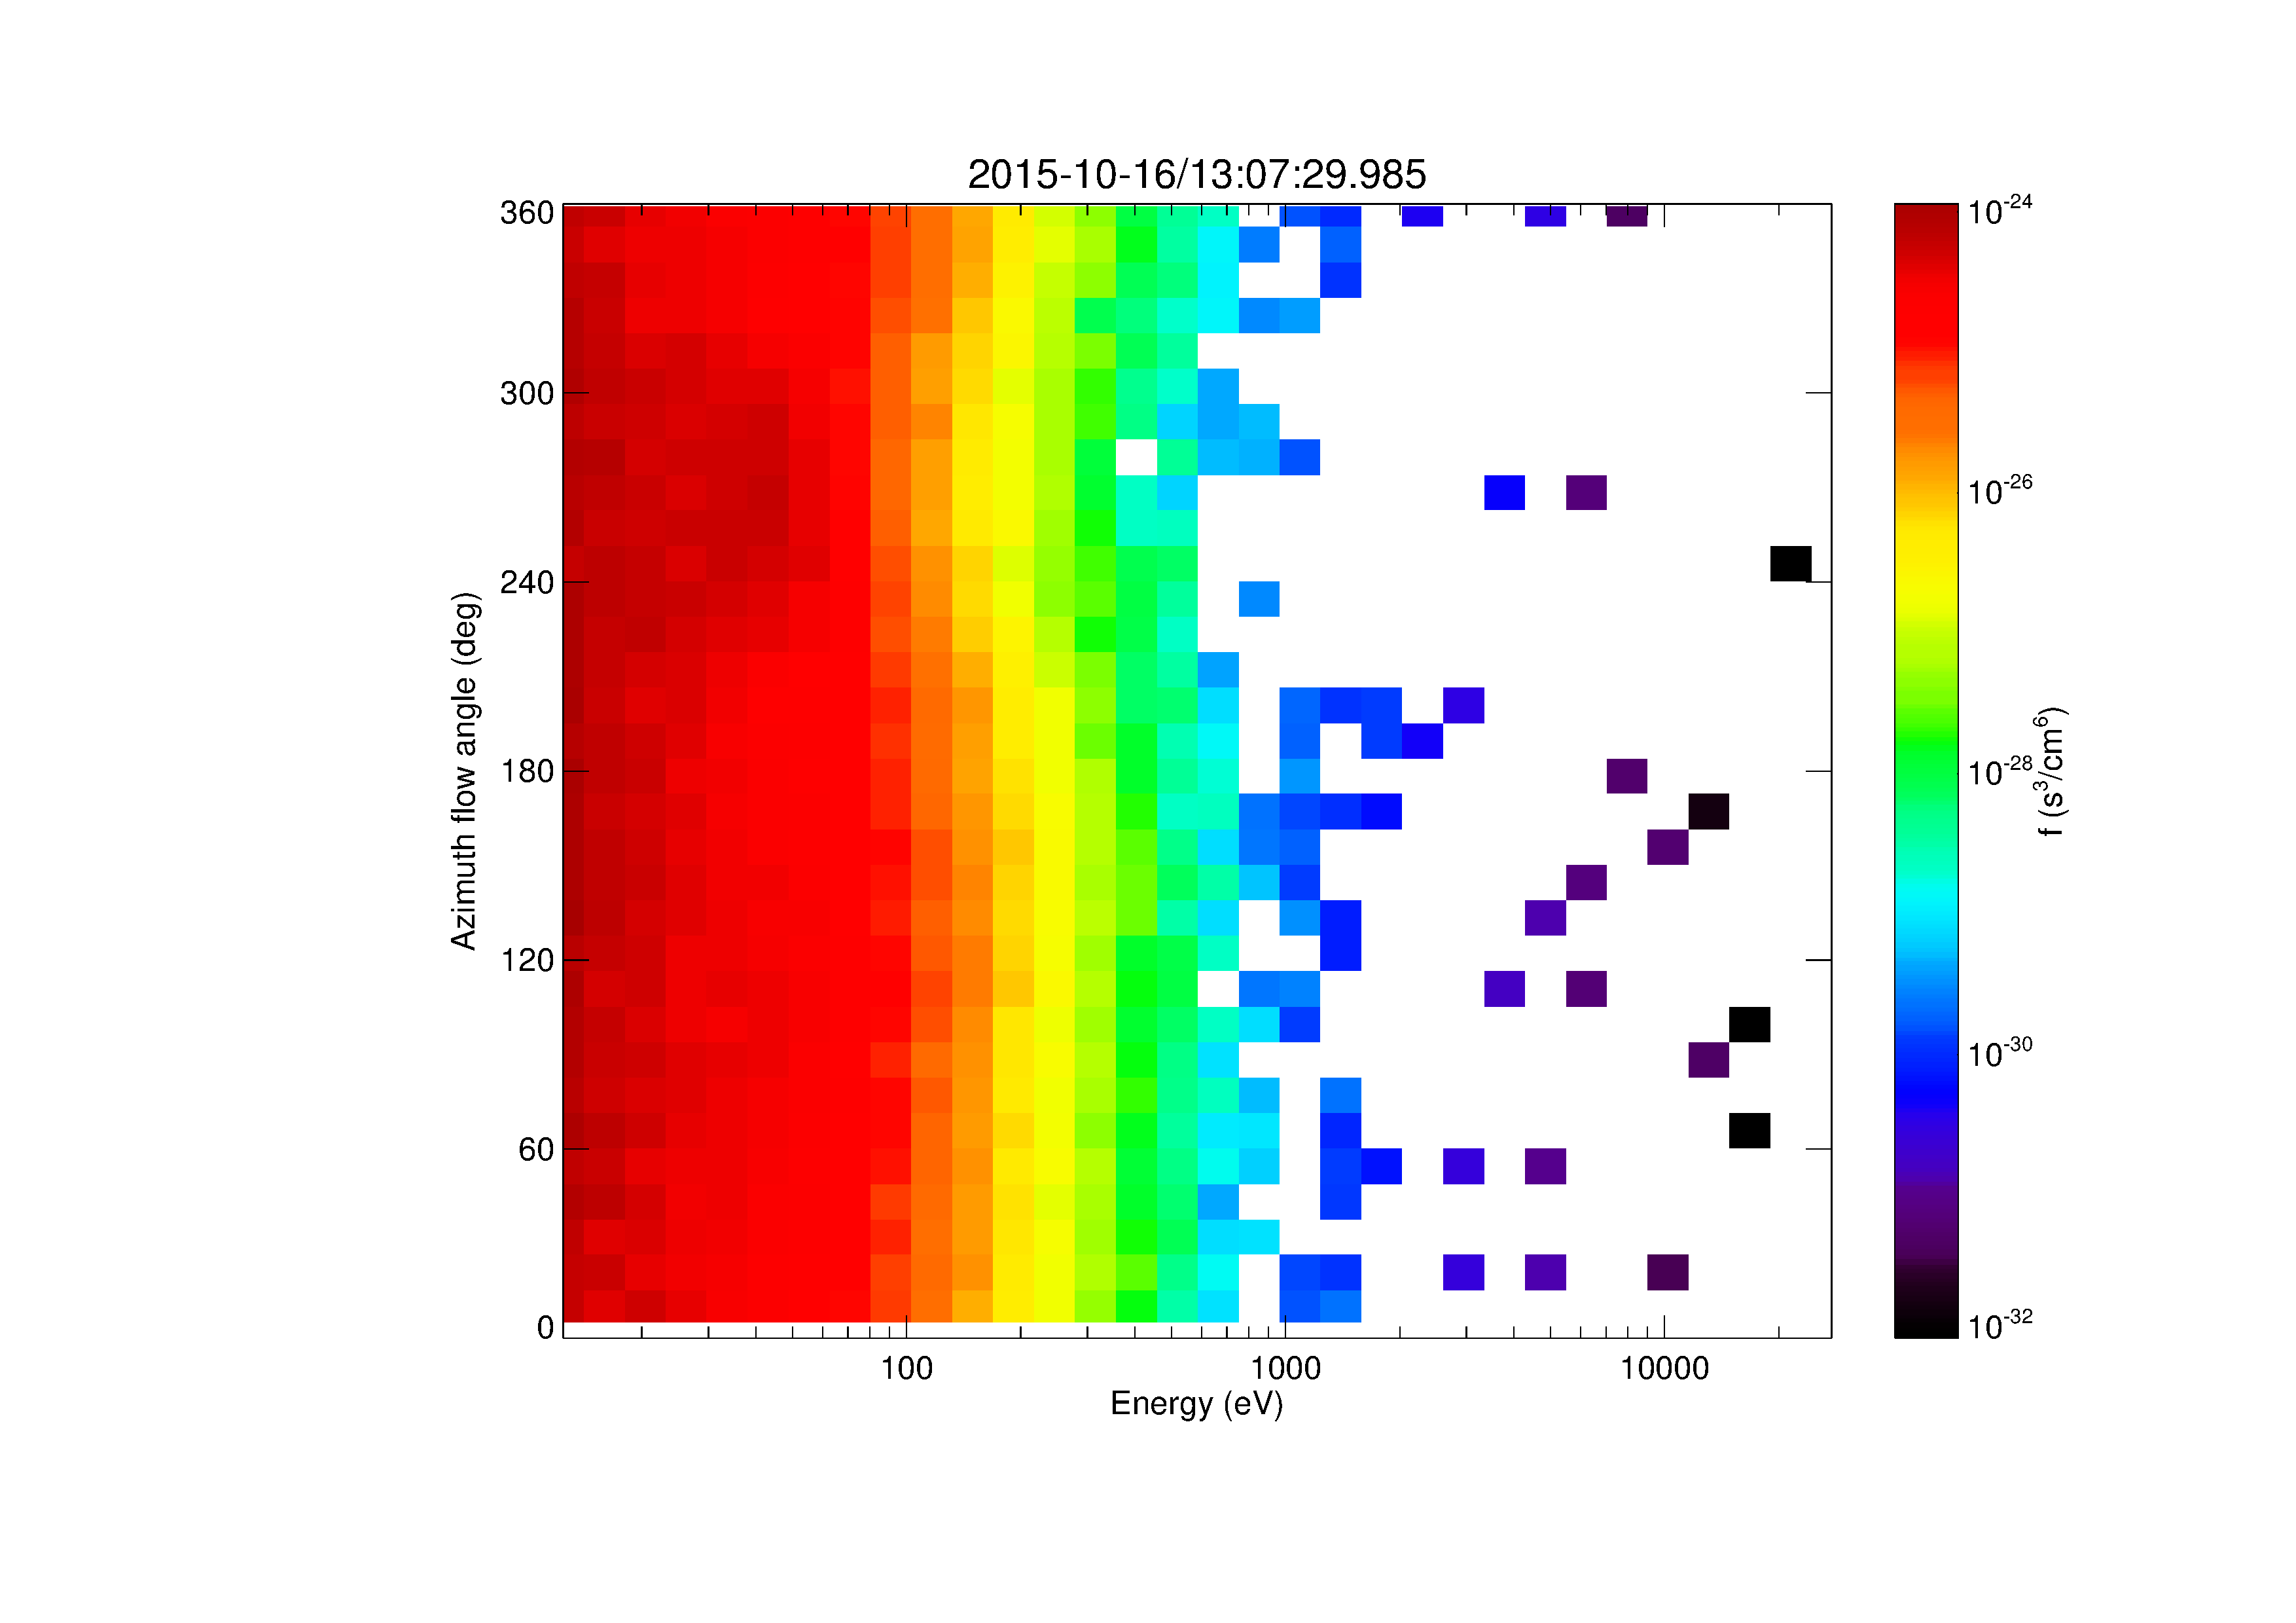
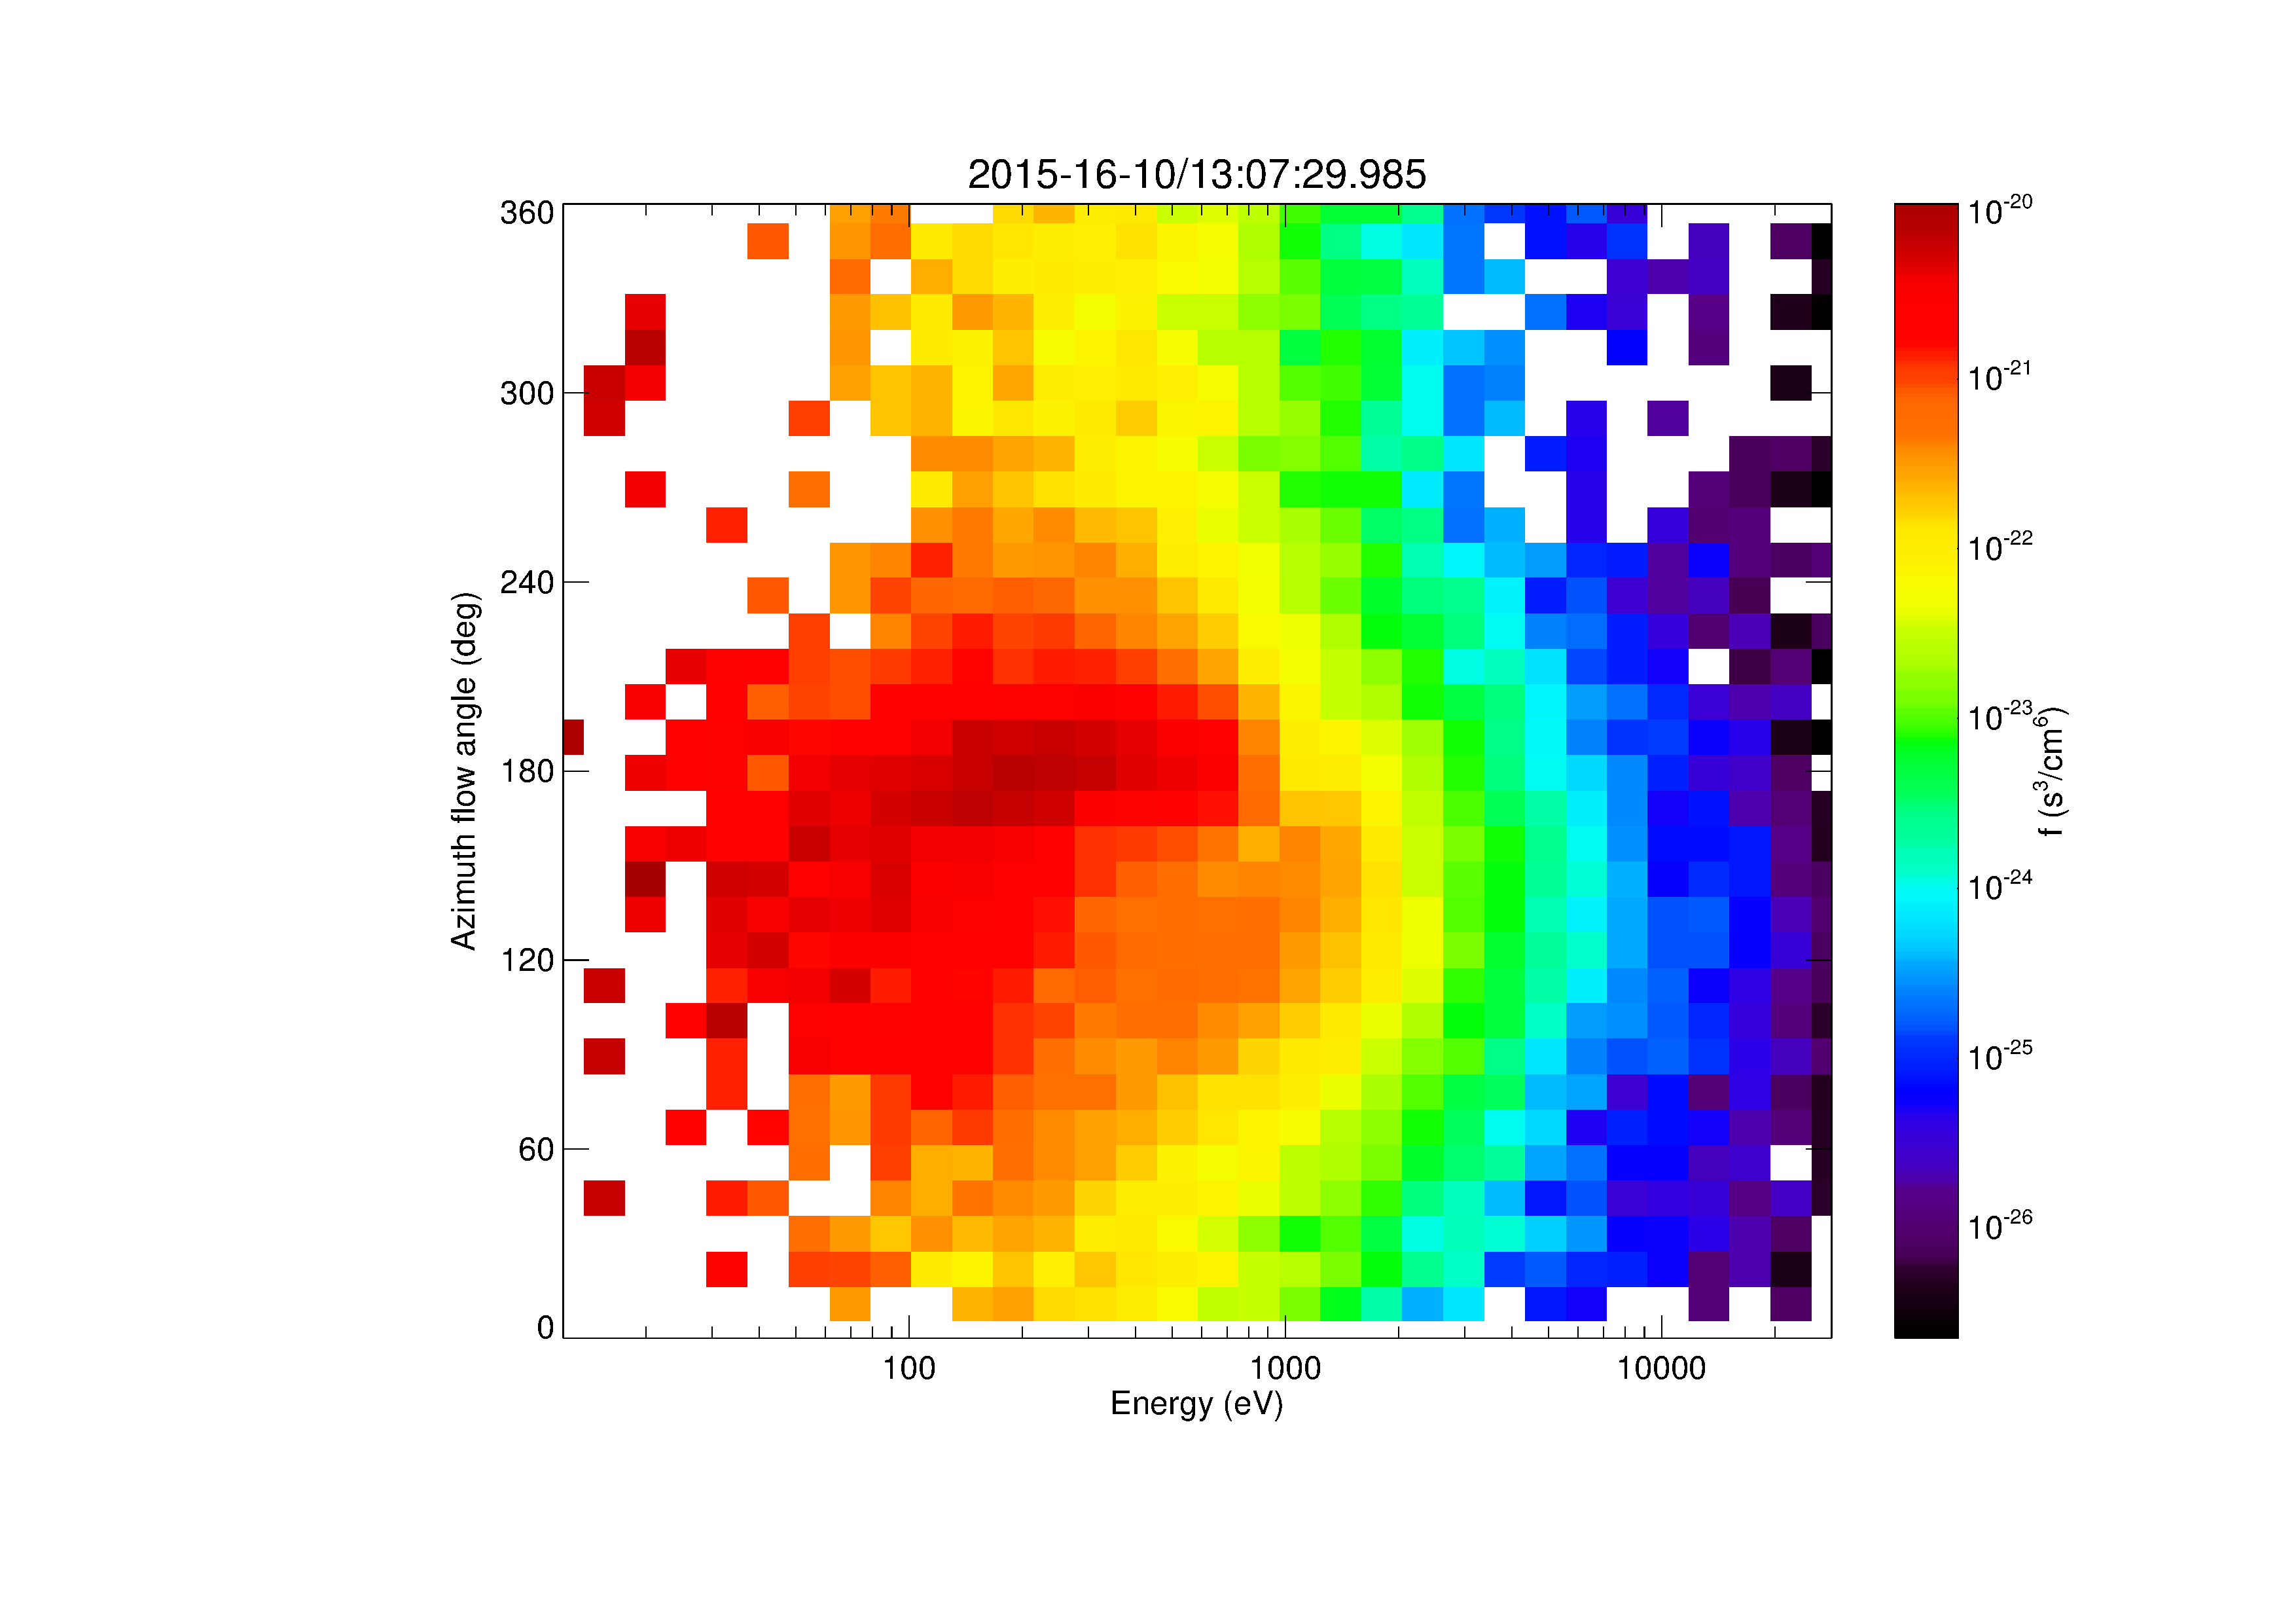
| 16:19, 18 May 2017 | Azimuth vs energy.png (file) |  |
61 KB | Egrimes | 1 | |
| 16:39, 18 May 2017 | Azimuth vs energy electrons.png (file) |  |
61 KB | Egrimes | 1 | |
| 16:40, 18 May 2017 | Azimuth vs zenith ions.png (file) |  |
61 KB | Egrimes | 1 | |
| 15:52, 17 May 2017 | Ions azimuth vs zenith.png (file) |  |
61 KB | Egrimes | 1 | |
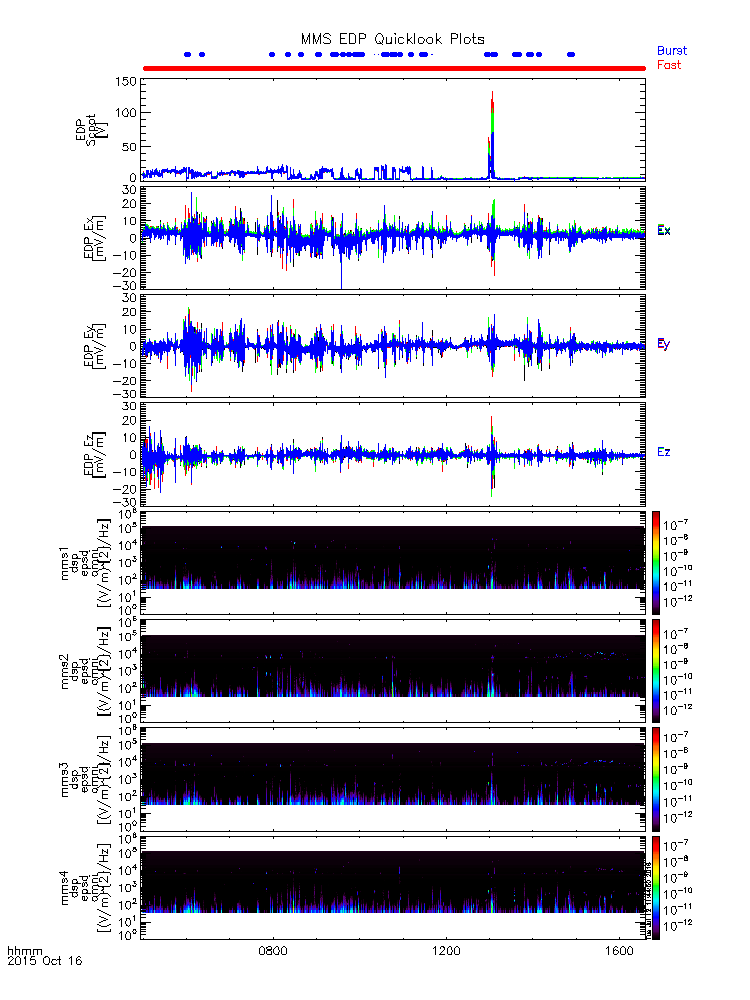
| 19:20, 12 July 2016 | MMS EDP fields quicklook.png (file) |  |
61 KB | Floresaa | MMS EDP quicklook plots from the fields quicklook crib sheet. | 1 |
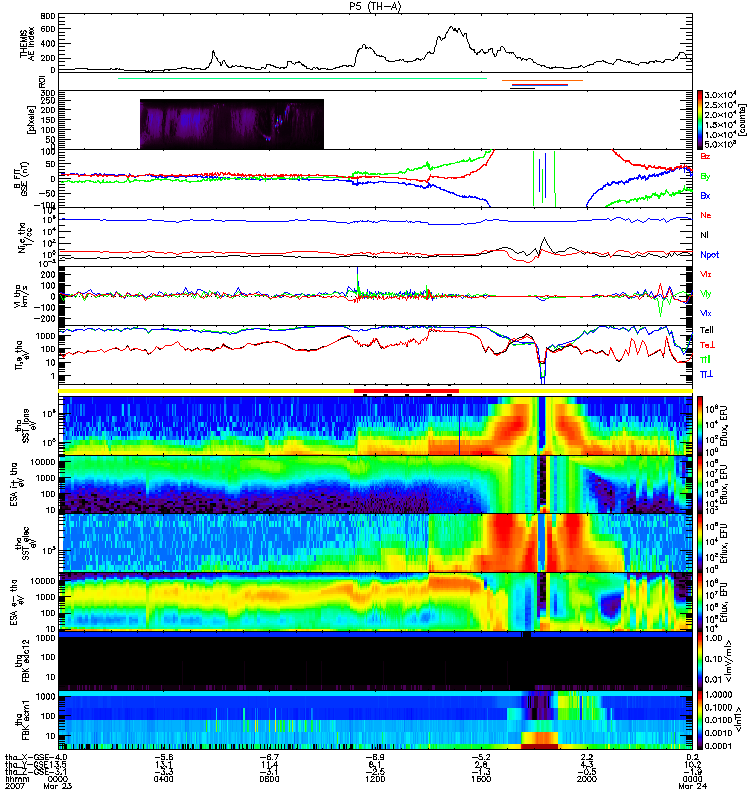
| 23:11, 1 April 2014 | Tha l2 overview 20070323 0024.png (file) |  |
61 KB | Floresaa | Single-day summary plot for THEMIS probe A on 2007-03-23. | 1 |
| 16:40, 18 May 2017 | Azimuth vs energy ions.png (file) |  |
62 KB | Egrimes | 1 | |
| 15:54, 17 May 2017 | Ions azimuth vs energy.png (file) |  |
62 KB | Egrimes | 1 | |
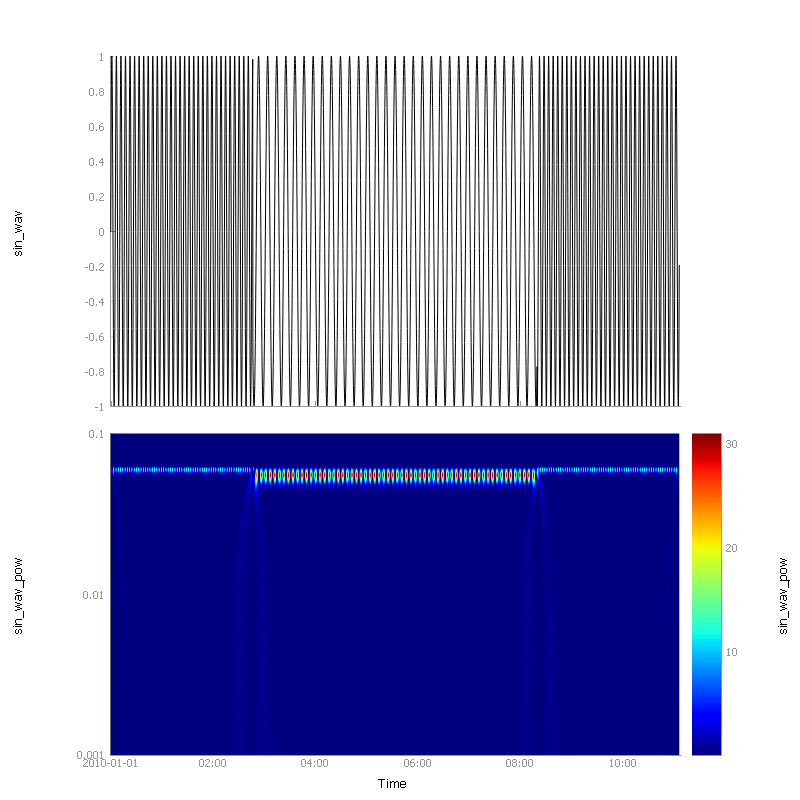
| 17:43, 3 May 2020 | Py gaus1 wavelet.png (file) |  |
62 KB | Nikos | Wavelet transformation using Gaussian Derivative wavelets. | 1 |
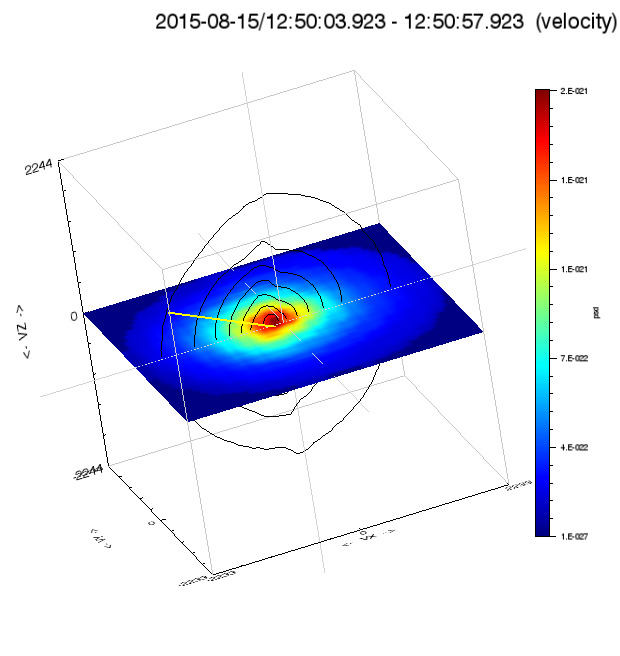
| 00:07, 12 March 2016 | Mms fpi contour.png (file) |  |
62 KB | Floresaa | Two-dimensional slice of single three-dimensional MMS FPI ion distribution. Color contours are drawn along the x-y plane with contour lines drawn on x-z. | 1 |
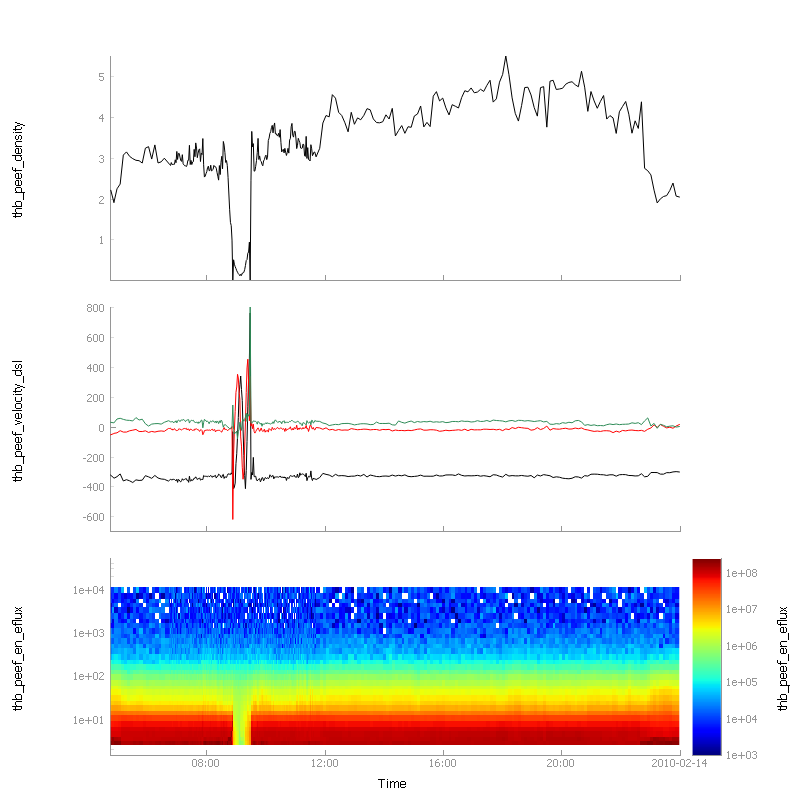
| 23:21, 24 April 2020 | Pyspedas plot spectra.png (file) |  |
62 KB | Nikos | Example of python pySPEDAS spectrogram plot. | 1 |
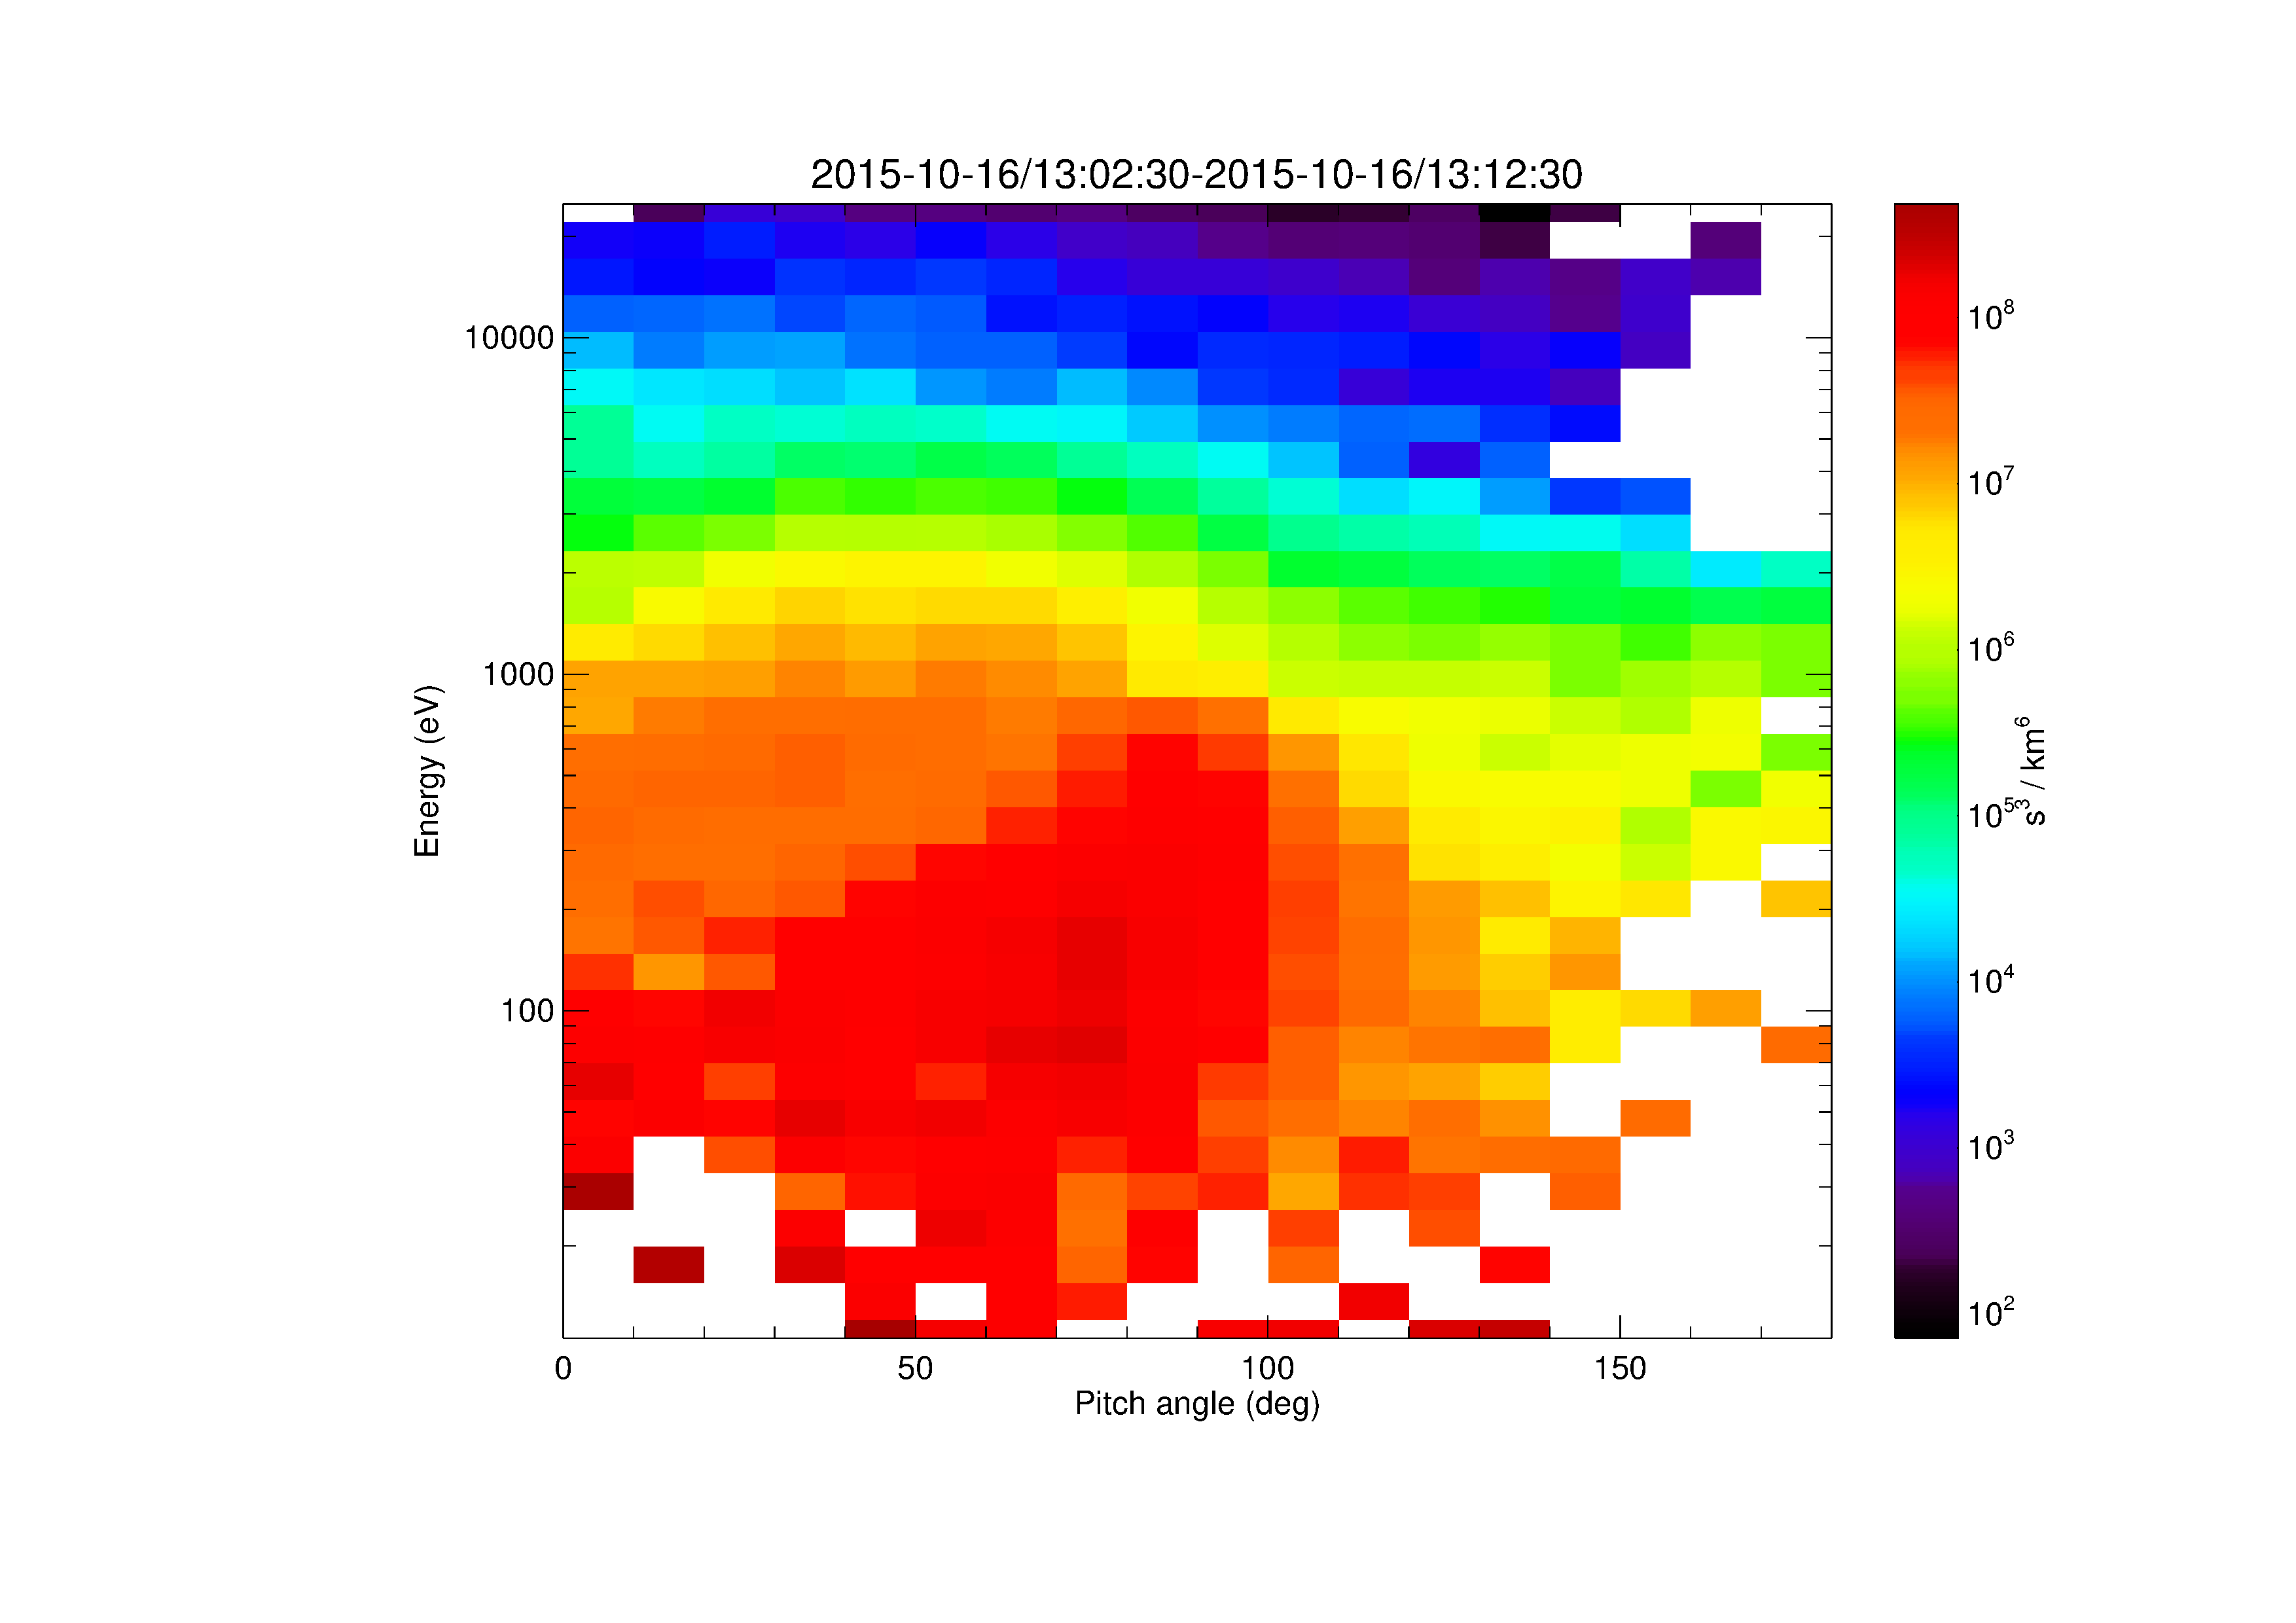
| 16:40, 18 May 2017 | Pad vs energy ions.png (file) |  |
63 KB | Egrimes | 1 | |
| 15:52, 17 May 2017 | Ions pad vs energy.png (file) |  |
64 KB | Egrimes | 1 |