File list
Jump to navigation
Jump to search
This special page shows all uploaded files.
| Date | Name | Thumbnail | Size | User | Description | Versions |
|---|---|---|---|---|---|---|
| 19:52, 14 April 2016 | 3.6.4b.png (file) |  |
20 KB | Nikos | Plot/Layout Options: Show Data Components | 1 |
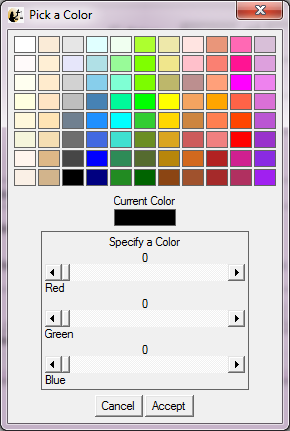
| 15:54, 14 August 2014 | Color palette.png (file) |  |
20 KB | Egrimes | SPEDAS color palette | 1 |
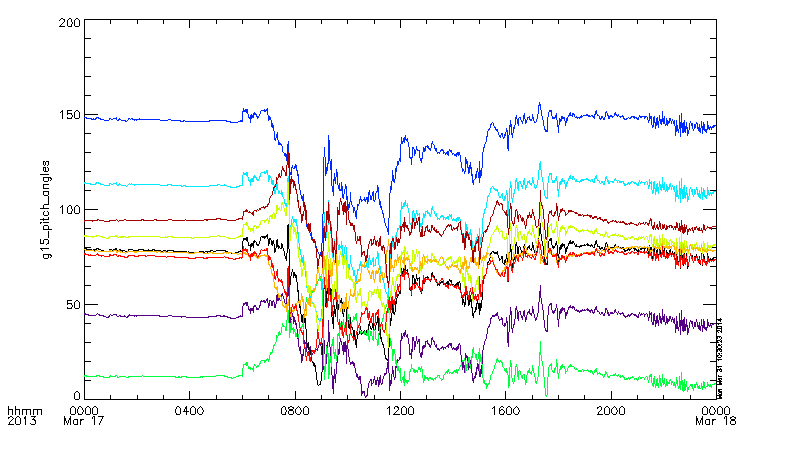
| 17:37, 31 March 2014 | Goes15 pitch angles.png (file) |  |
21 KB | Egrimes | GOES-15 pitch angles on March 17, 2013 | 1 |
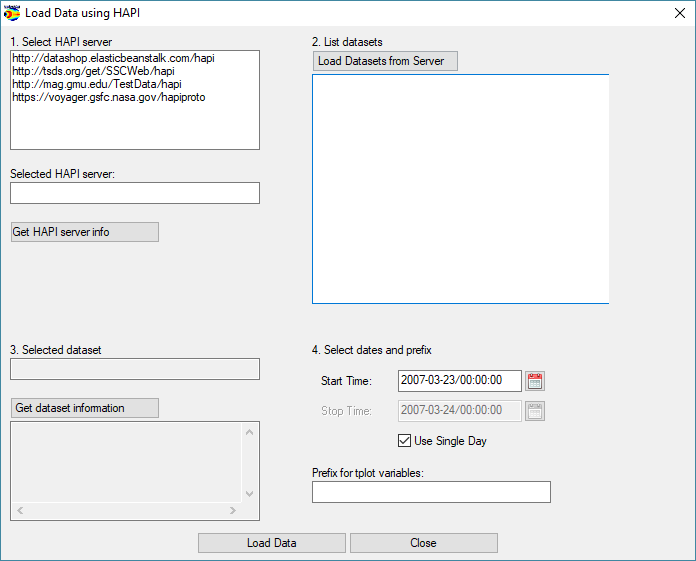
| 20:19, 14 November 2018 | Load data using HAPI.png (file) |  |
21 KB | Nikos | Spedas 3.1 | 1 |
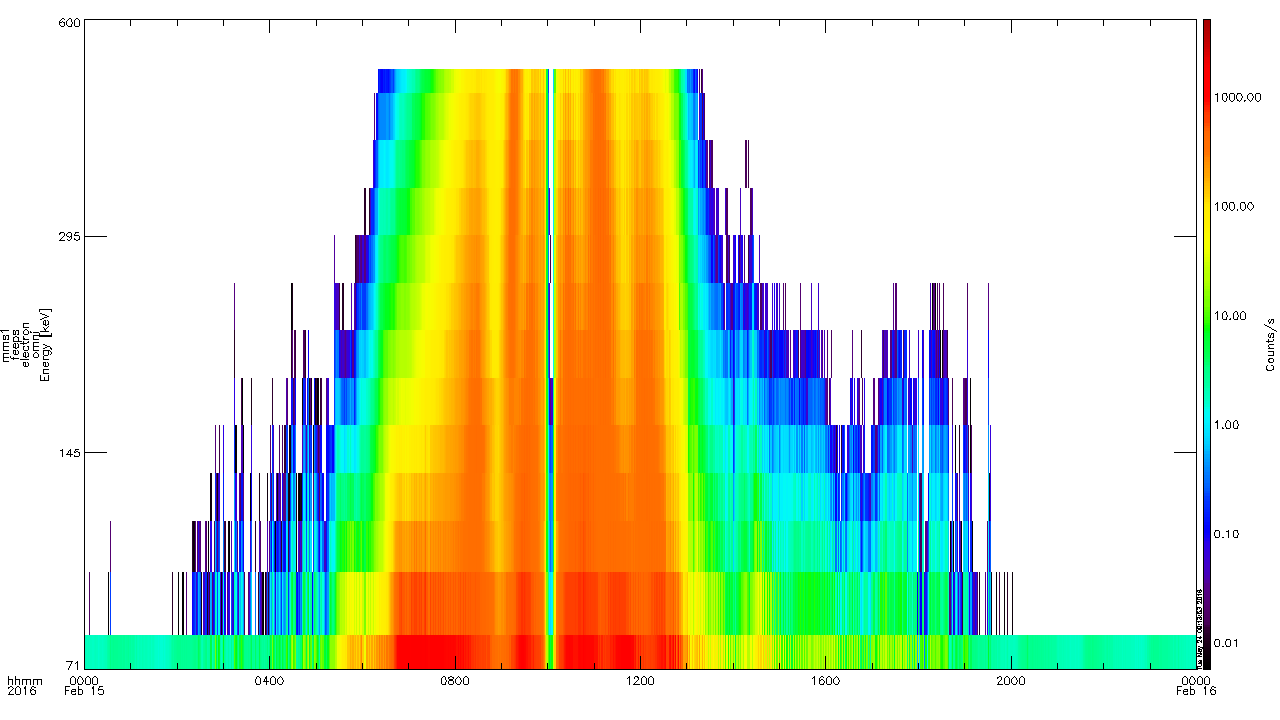
| 16:17, 24 May 2016 | FEEPS electron omni spin plot.png (file) |  |
21 KB | Clrussell | FEEPS Electron Omni Spin Data | 1 |
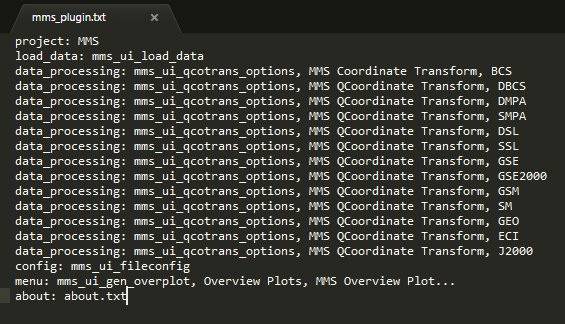
| 19:39, 30 April 2018 | Mms plugin textfile.png (file) |  |
22 KB | Egrimes | 3 | |
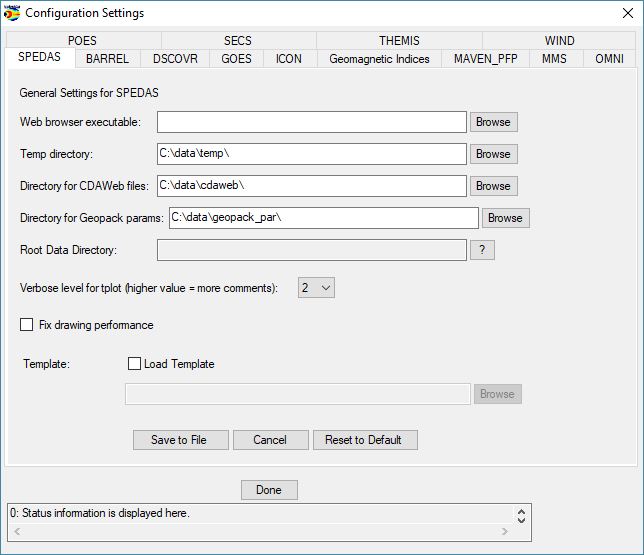
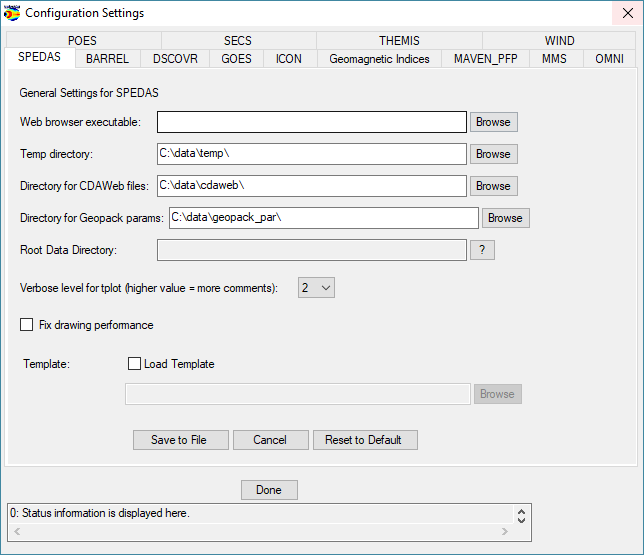
| 18:02, 17 October 2018 | Configuration settings.png (file) |  |
22 KB | Nikos | Spedas 3.1 Configuration Settings | 4 |
| 22:06, 26 October 2018 | Configuration settings 31.png (file) |  |
22 KB | Nikos | Spedas 3.1 GUI | 2 |
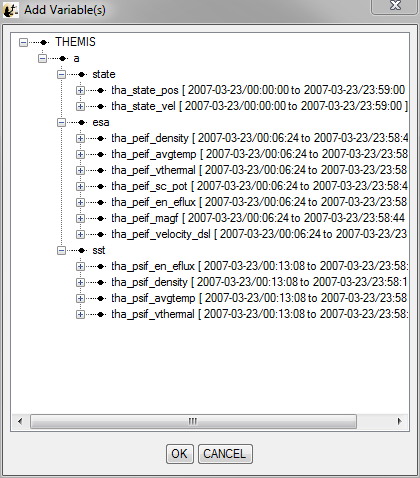
| 20:43, 14 April 2016 | 3.6.10b.png (file) |  |
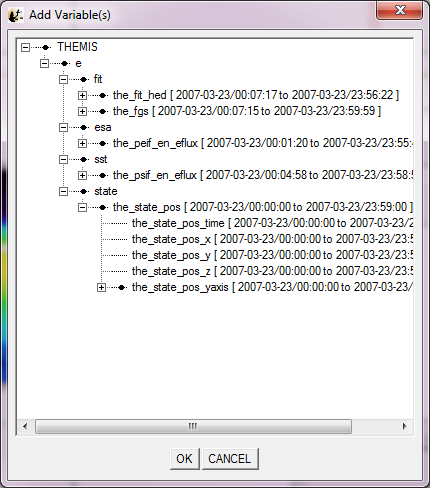
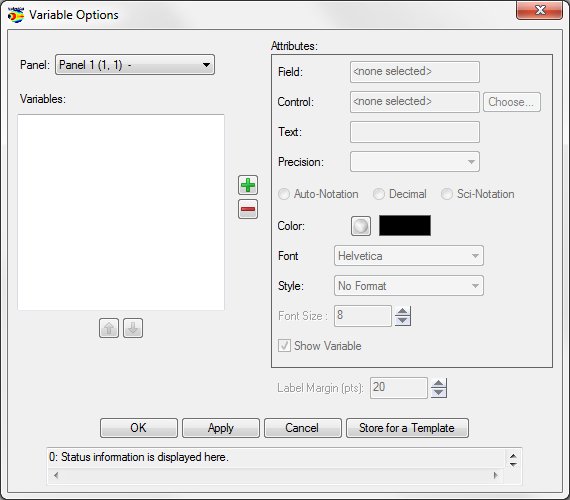
22 KB | Nikos | Variable Options: Add Variables | 1 |
| 16:52, 15 August 2014 | Verify data.png (file) |  |
23 KB | Egrimes | SPEDAS verify data | 1 |
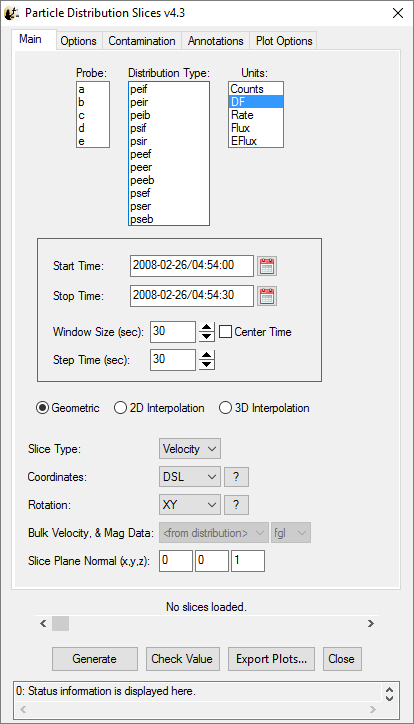
| 21:36, 14 April 2016 | 3.8.4.png (file) |  |
24 KB | Nikos | Tools Menu: THEMIS Particle Distribution Slices | 1 |
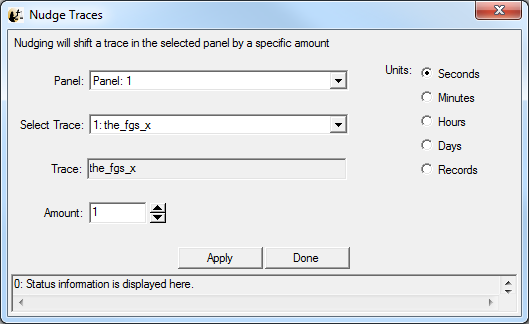
| 22:20, 27 February 2014 | Nudge traces.png (file) |  |
24 KB | Egrimes | Nudge traces | 1 |
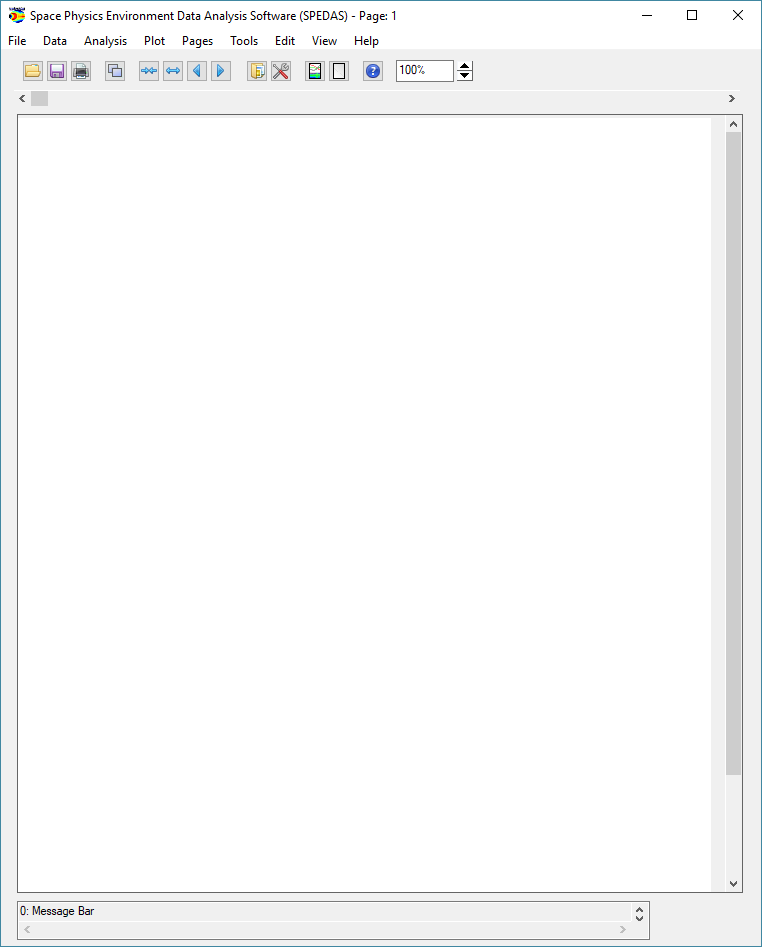
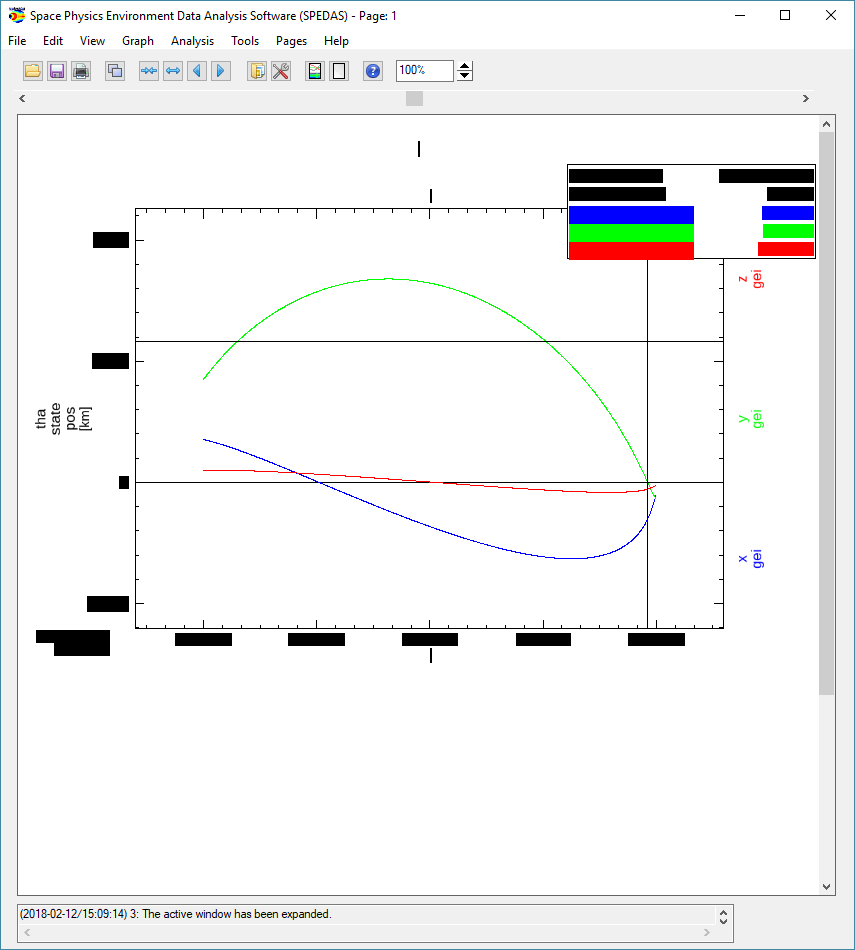
| 22:08, 26 October 2018 | Main window1.png (file) |  |
24 KB | Nikos | Spedas 3.1 GUI | 3 |
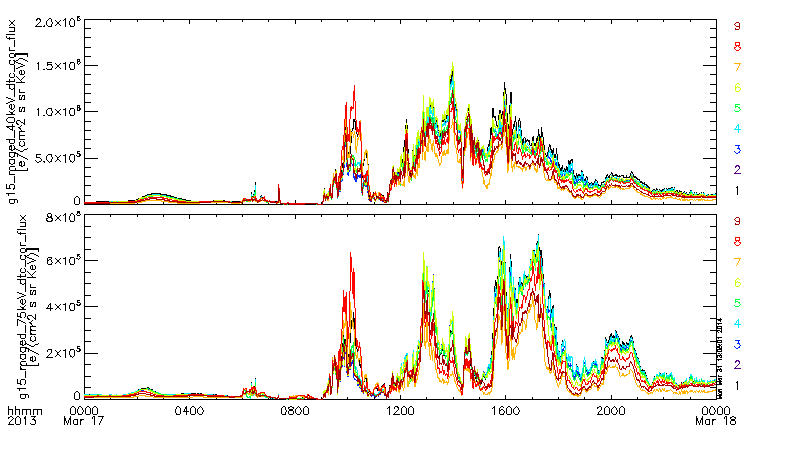
| 20:08, 31 March 2014 | Goes15 maged example.png (file) |  |
24 KB | Egrimes | GOES-15 MAGED data at 40 keV, 75 keV | 1 |
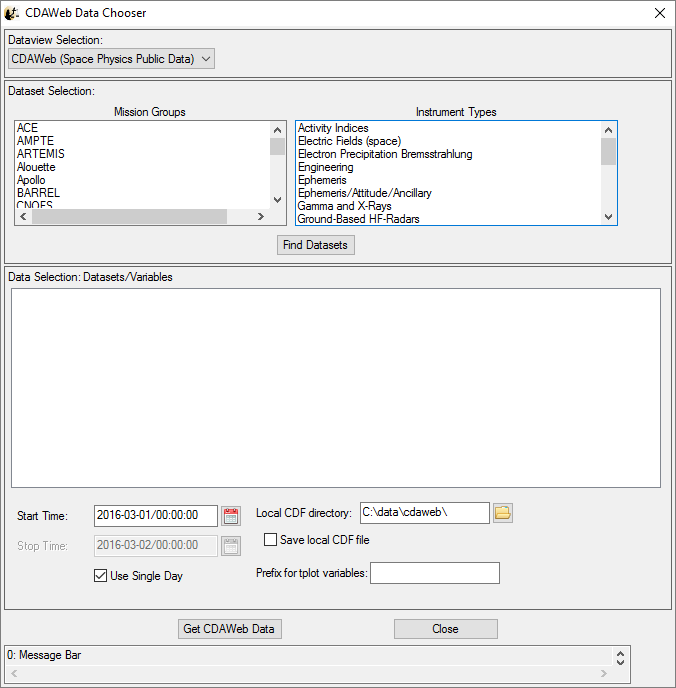
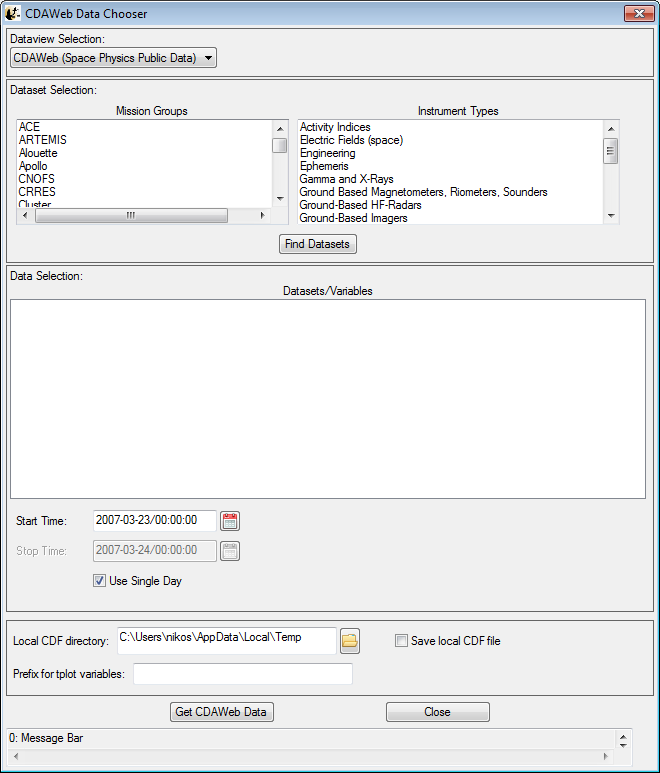
| 18:33, 19 April 2016 | Load data cdaweb.png (file) |  |
25 KB | Nikos | Load Data using CDAWeb | 1 |
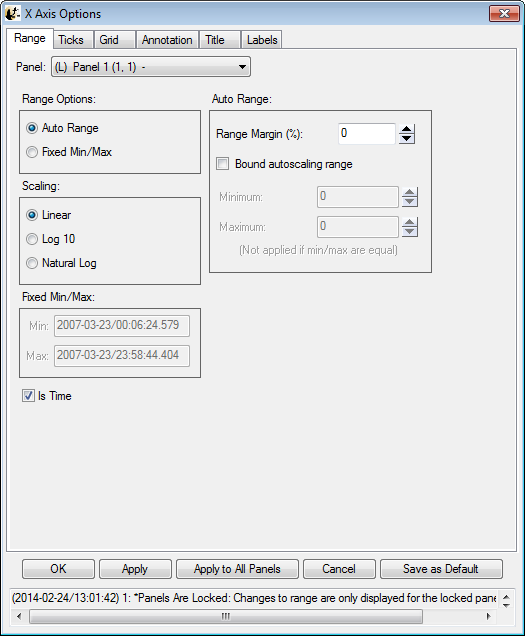
| 21:03, 24 February 2014 | Xaxis options.png (file) |  |
26 KB | Nikos | X-axis options | 1 |
| 21:30, 15 August 2018 | Goes goes13 20170101 0024.png (file) |  |
26 KB | Nikos | Example of GOES summary plot | 1 |
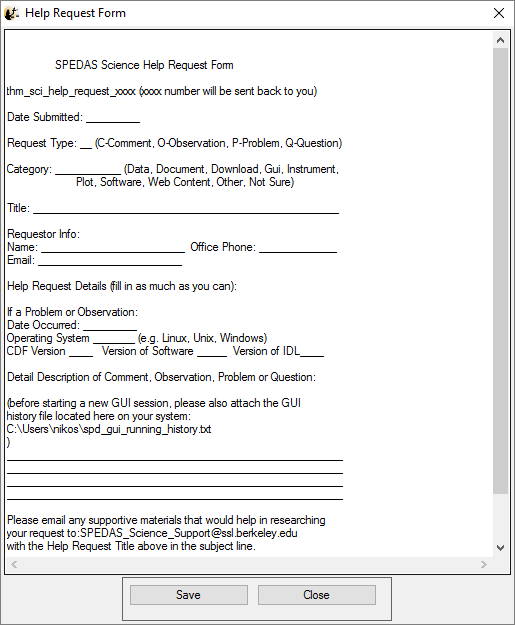
| 22:05, 14 April 2016 | 3.10.2.png (file) |  |
27 KB | Nikos | Help Request Form | 1 |
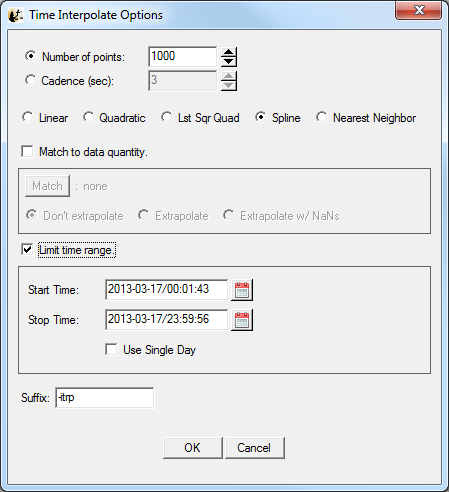
| 22:16, 27 February 2014 | Dproc interpolation options.png (file) |  |
27 KB | Egrimes | Interpolation of data | 1 |
| 01:12, 27 March 2018 | Multiple plot test.png (file) |  |
27 KB | Adrozdov | Screenshot of introductory example multiple_plot_test | 1 |
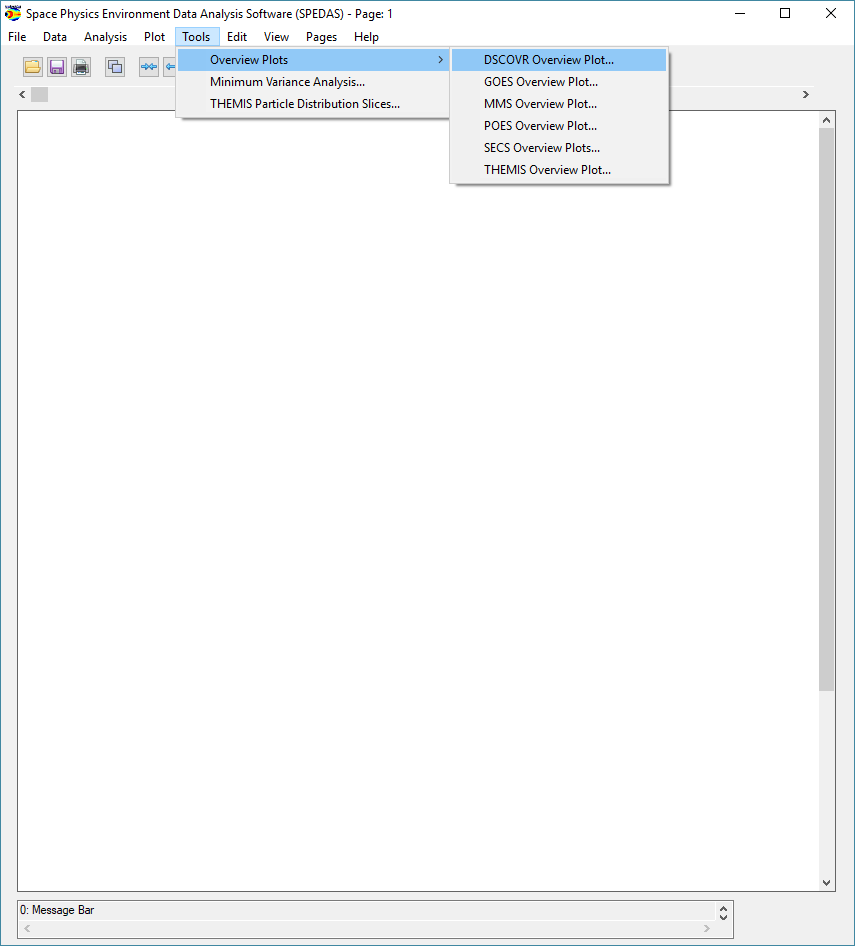
| 19:41, 22 October 2018 | Tools.png (file) |  |
27 KB | Nikos | Spedas GUI 3.1 | 2 |
| 19:54, 21 August 2014 | Wiki logo draft.jpg (file) | 27 KB | Pcruce | draft logo from Emmanuel Masongsong. | 1 | |
| 17:58, 30 April 2018 | Data processing.png (file) |  |
28 KB | Egrimes | 2 | |
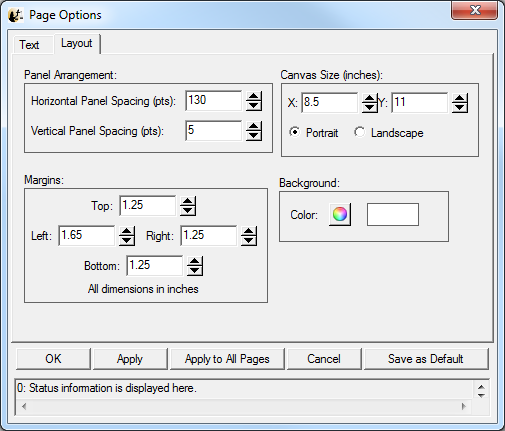
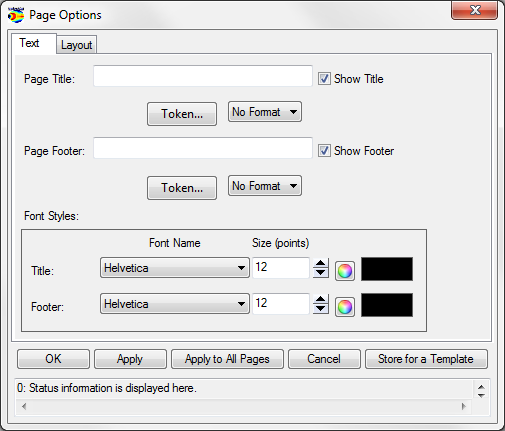
| 21:53, 27 February 2014 | Page options layout.png (file) |  |
28 KB | Egrimes | Page Options | Layout | 1 |
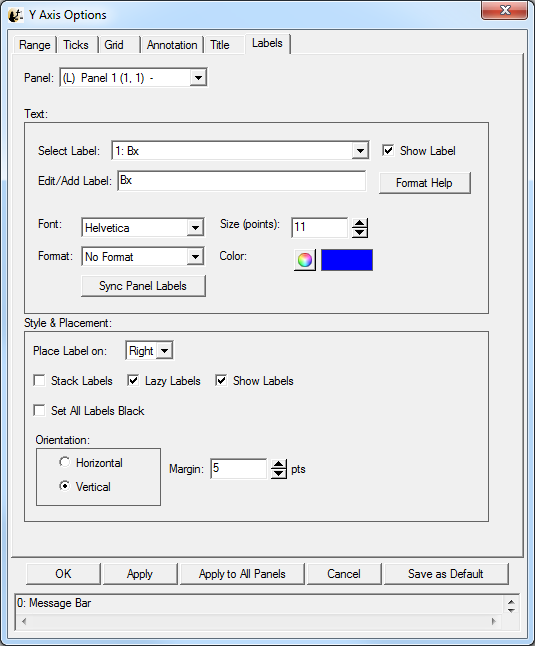
| 16:50, 28 February 2014 | Yaxis options labels.png (file) |  |
29 KB | Egrimes | Y-axis options, labels tab | 1 |
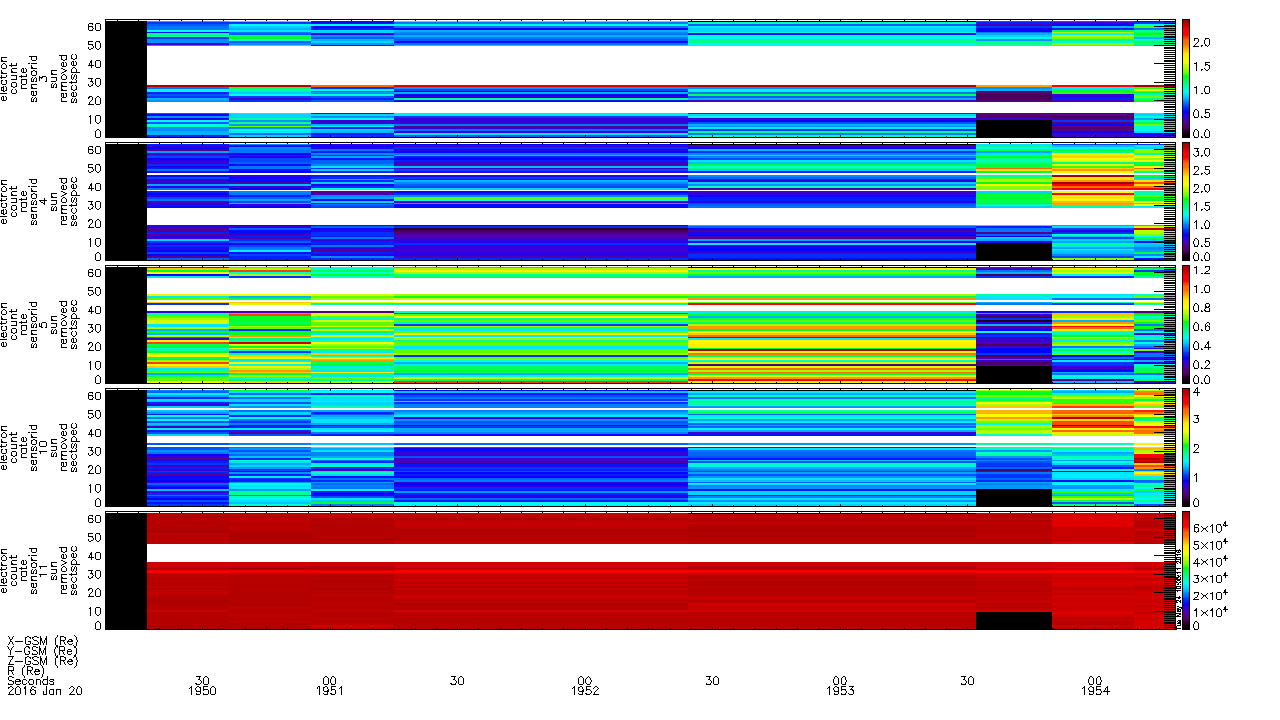
| 17:08, 24 May 2016 | FEEPS Sector Time Spectrograms plot sun removed.png (file) |  |
30 KB | Clrussell | FEEPS Sector-Time Spectrograms with Sun Contamination Removed | 1 |
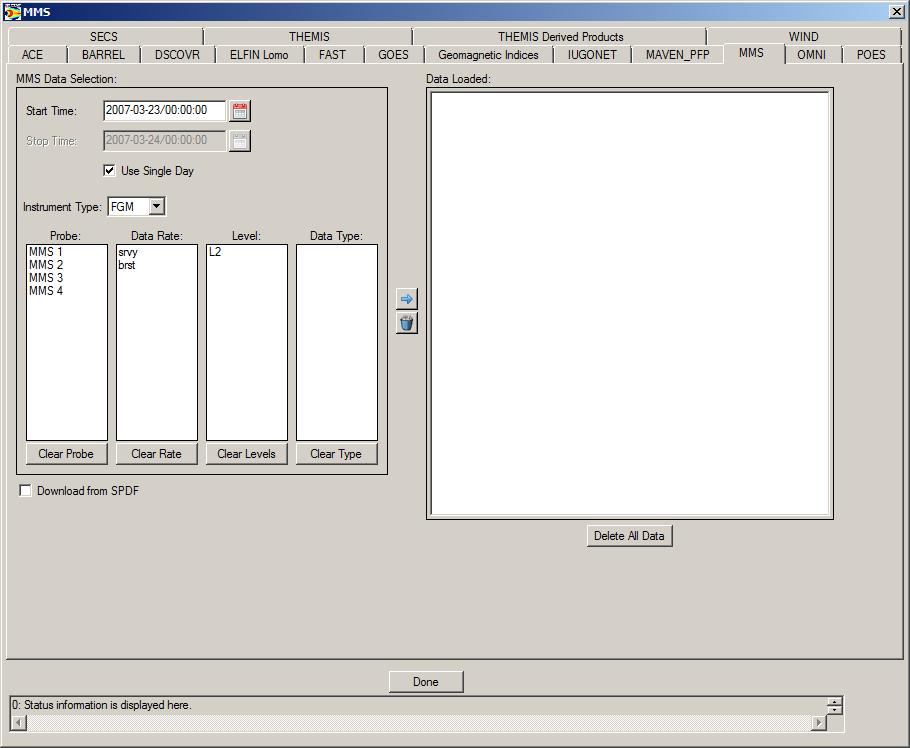
| 17:51, 30 April 2018 | Mms load data.png (file) |  |
30 KB | Egrimes | 1 | |
| 20:56, 24 February 2014 | Load from cdaweb.png (file) |  |
31 KB | Nikos | Load data from CDAWeb | 1 |
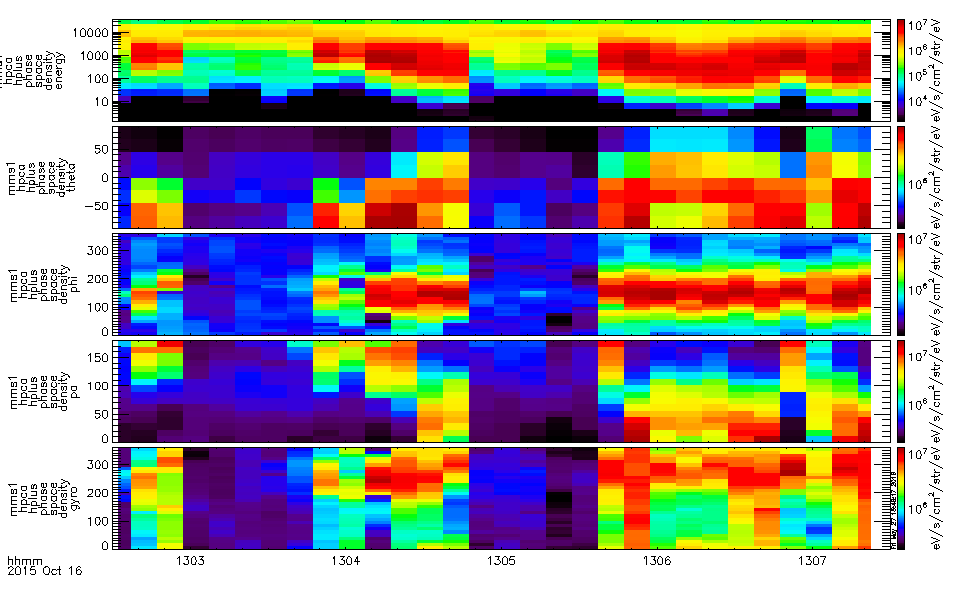
| 23:02, 27 May 2016 | Hpca spd spec.png (file) |  |
31 KB | Floresaa | Example of spectrograms calculated from 3D HPCA H+ distributions. Displayed: H+ energy, phi (sc-azimuth), theta (sc-elevation), pitch angle (mag-co-lat), and gyrophase (mag-azimuth). | 1 |
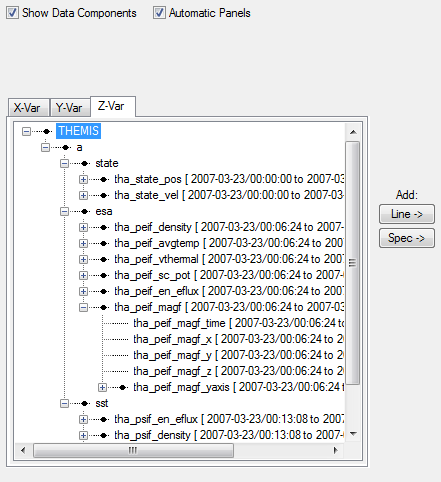
| 15:55, 14 August 2014 | Data tree.png (file) |  |
32 KB | Egrimes | SPEDAS data tree | 1 |
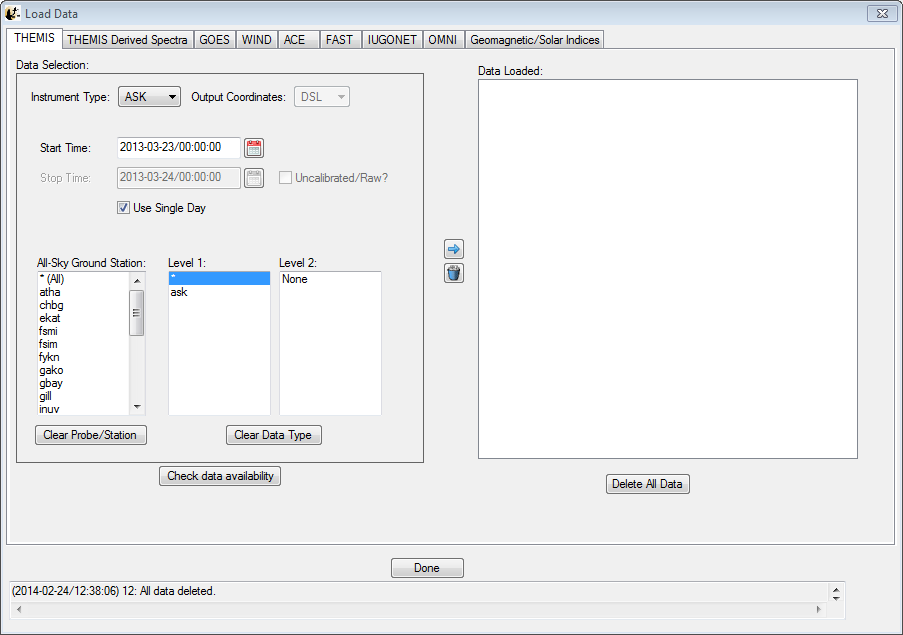
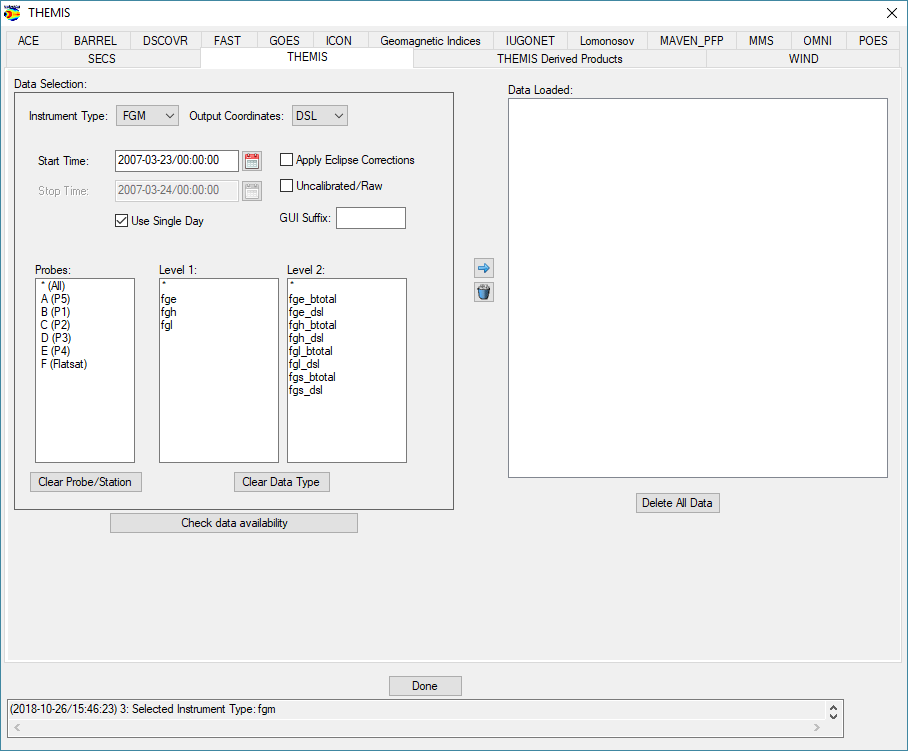
| 20:56, 24 February 2014 | Load from themis.png (file) |  |
32 KB | Nikos | Load data | 1 |
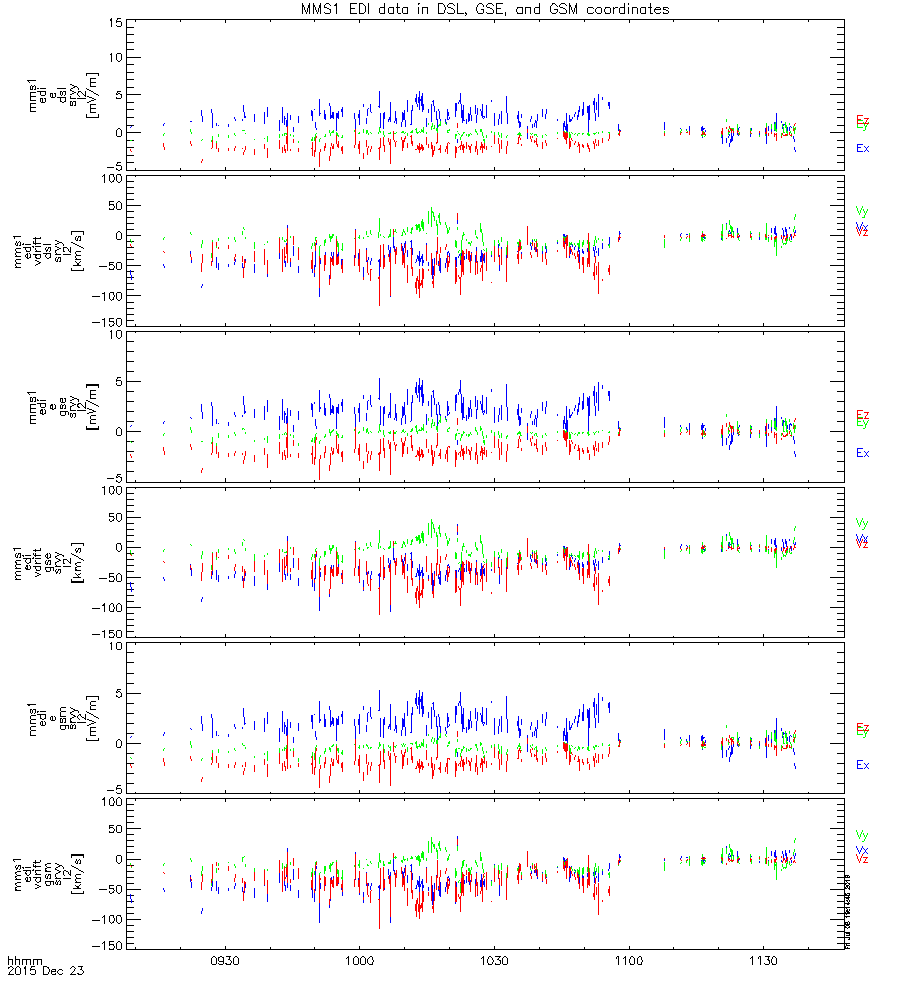
| 02:15, 9 July 2016 | EDI overview.png (file) |  |
32 KB | Floresaa | MMS1 l2 EDI data in DSL, GSE, and GSM coordinates. | 1 |
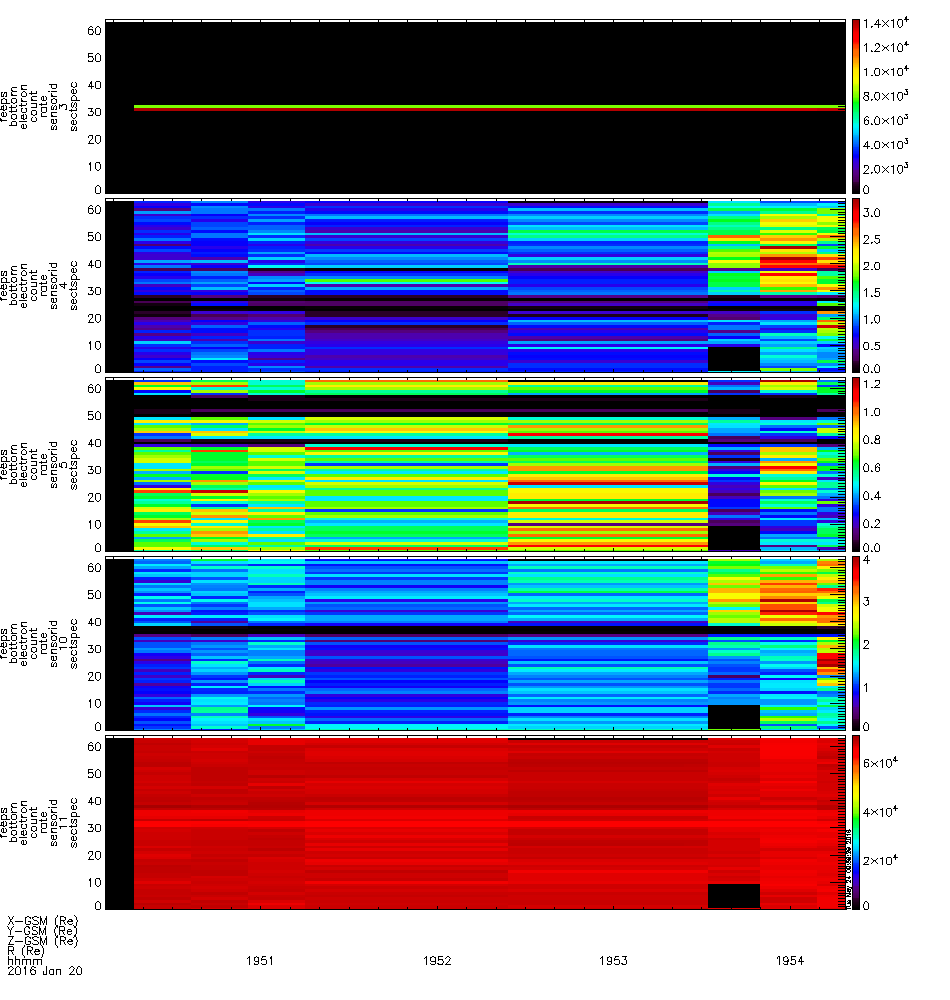
| 17:03, 24 May 2016 | FEEPS Sector Time Spectrograms plot.png (file) |  |
32 KB | Clrussell | MMS FEEPS Data, Sector-Time Spectrogram Plot | 1 |
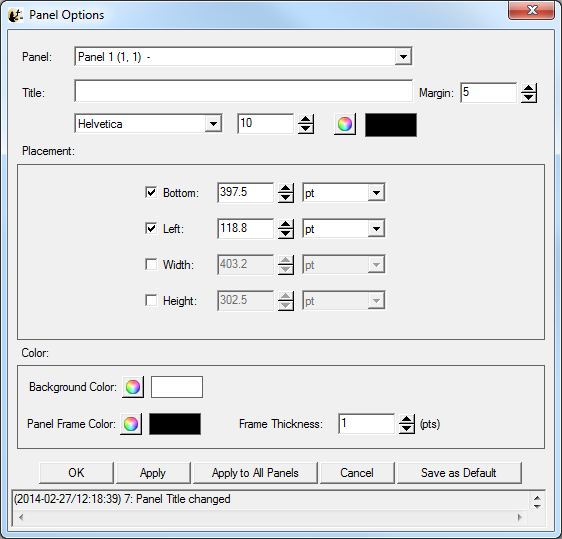
| 21:53, 27 February 2014 | Panel options.png (file) |  |
32 KB | Egrimes | Panel Options | 1 |
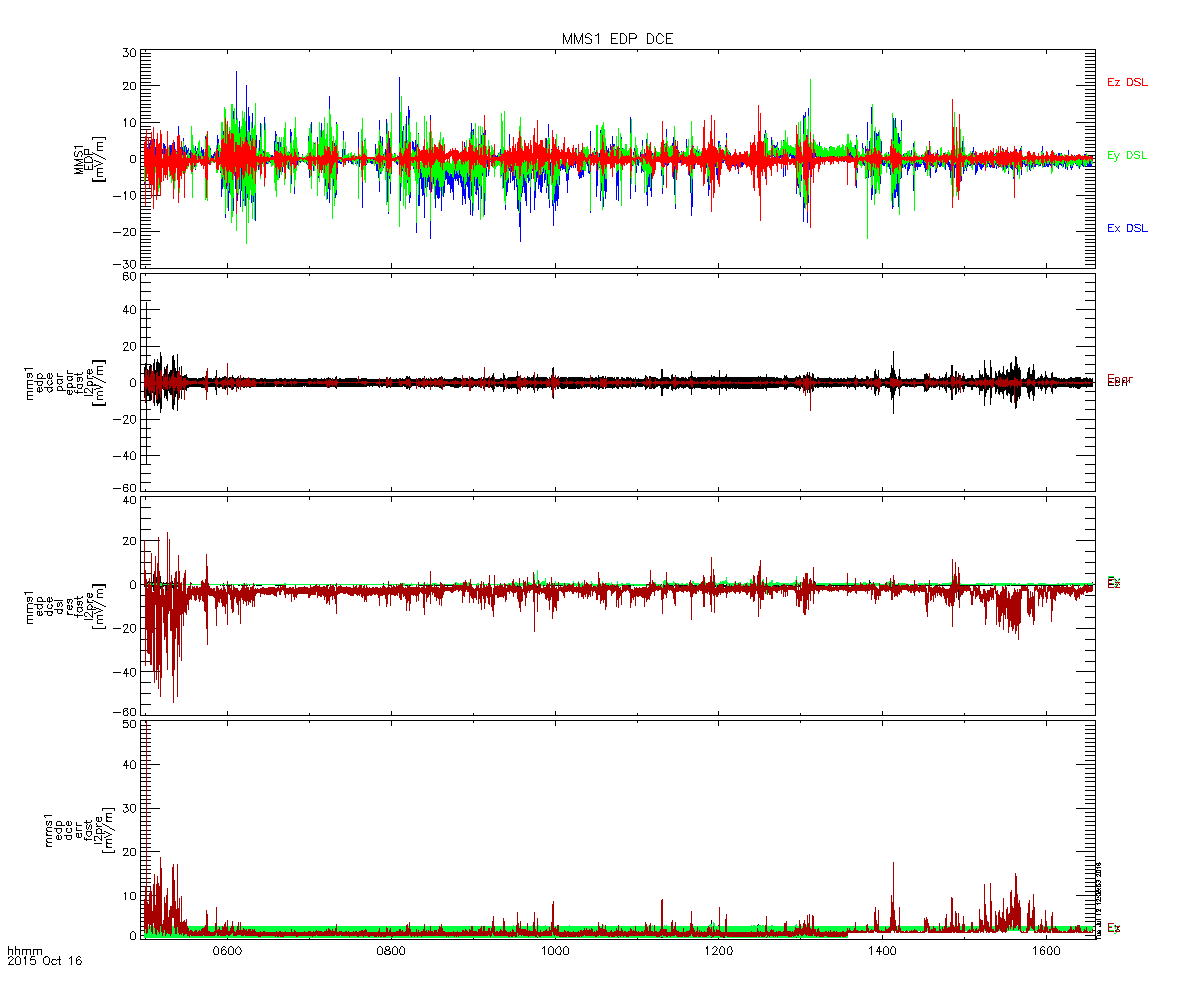
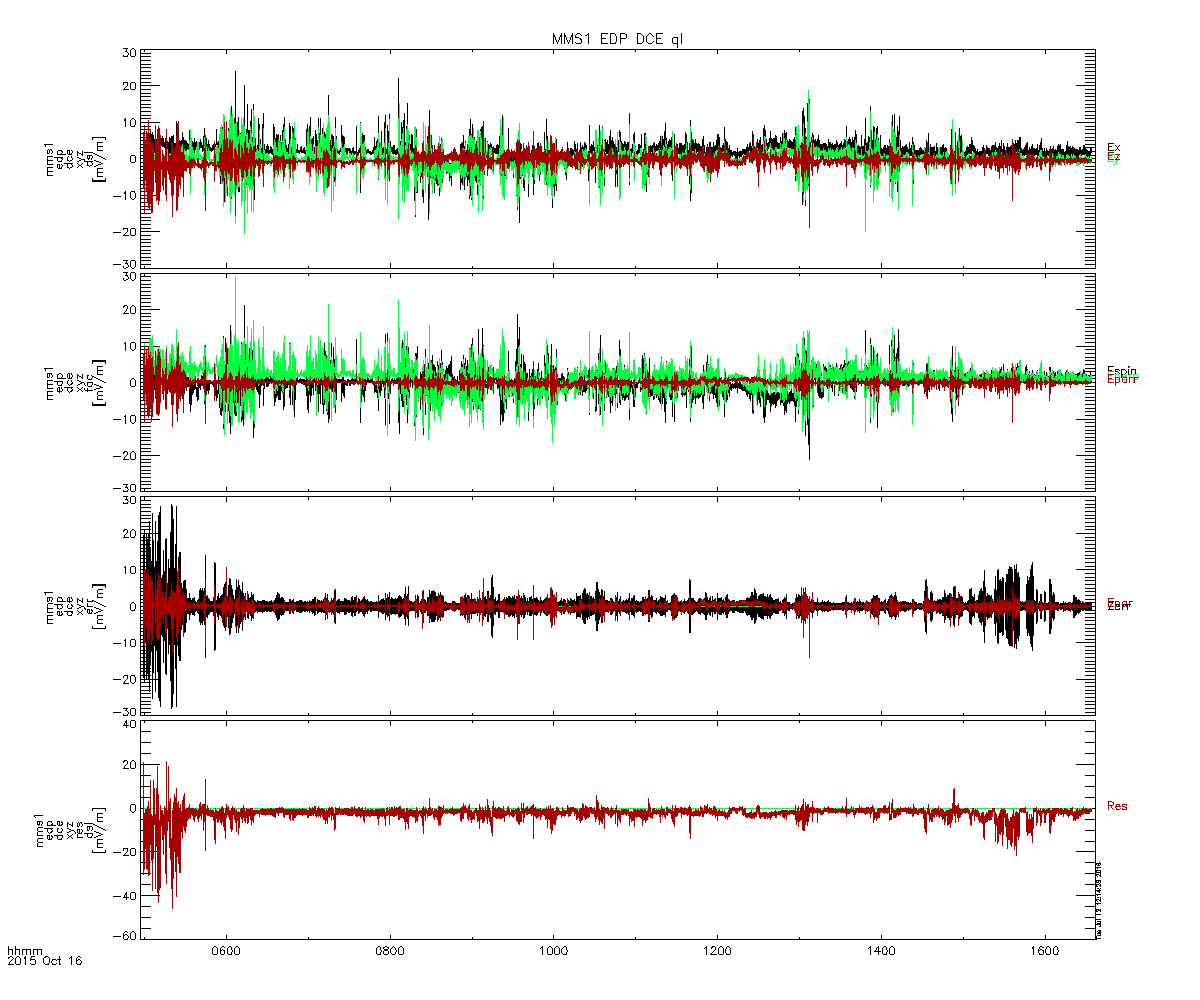
| 19:24, 12 July 2016 | MMS EDP DCE.png (file) |  |
32 KB | Floresaa | MMS1 EDP l2 DCE data. | 1 |
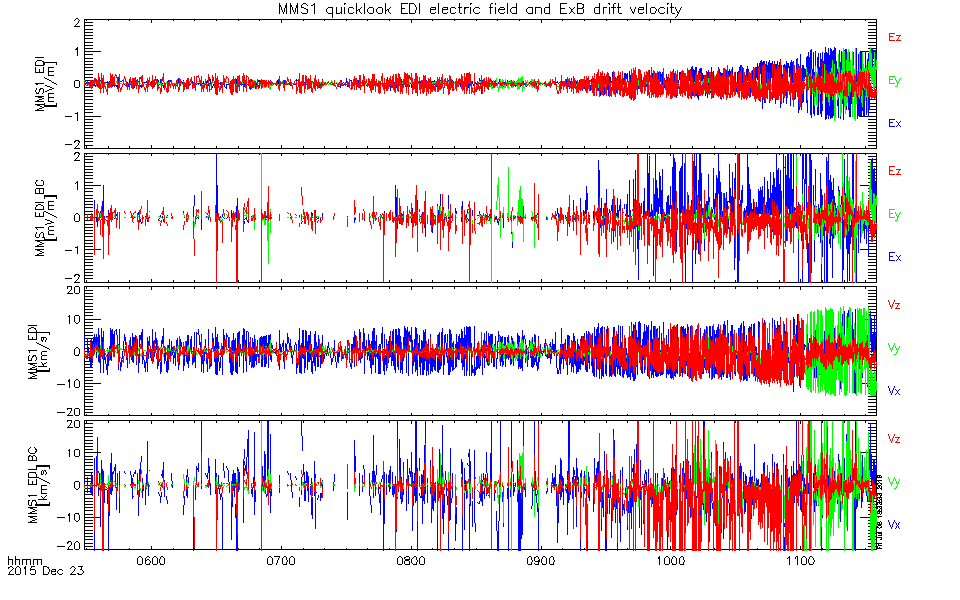
| 02:02, 9 July 2016 | EDI ql.png (file) |  |
33 KB | Floresaa | MMS1 quicklook EDI electric field and ExB drift velocity - "bestarg" and "beam convergence" methods. | 1 |
| 22:47, 26 October 2018 | Load data.png (file) |  |
33 KB | Nikos | Spedas 3.1 GUI | 2 |
| 23:18, 24 April 2020 | Idl plot spectra.png (file) |  |
34 KB | Nikos | Example of IDL SPEDAS spectrogram plot. | 1 |
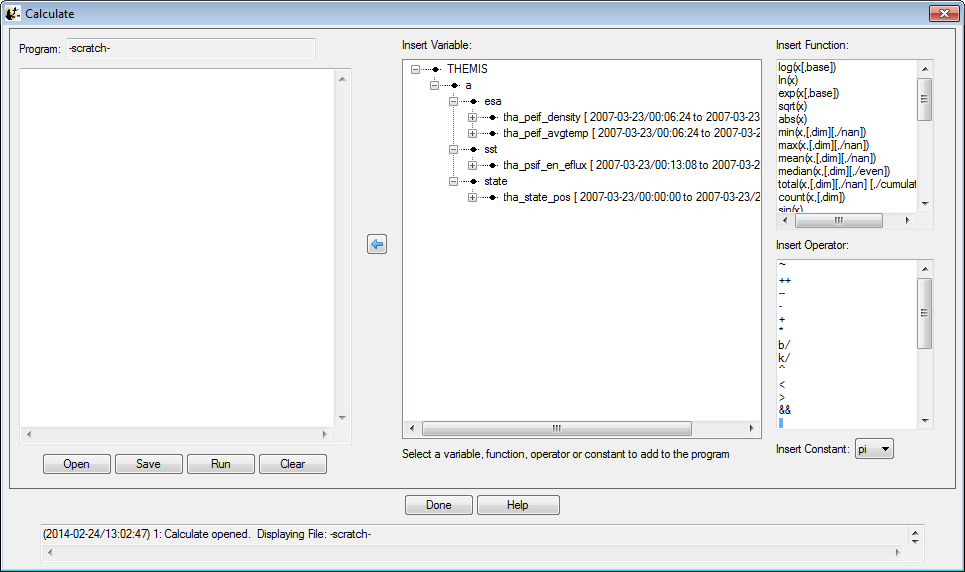
| 21:04, 24 February 2014 | Calculate.png (file) |  |
34 KB | Nikos | Calculate | 1 |
| 15:02, 9 May 2018 | 3.6.6a.png (file) |  |
34 KB | Clrussell | 5 | |
| 15:11, 9 May 2018 | 3.6.6c.png (file) |  |
34 KB | Clrussell | 3 | |
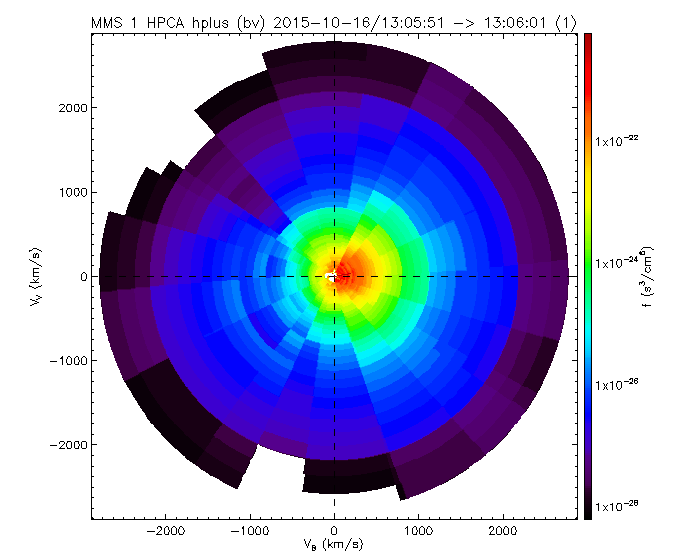
| 23:10, 27 May 2016 | Hpca slice bins.png (file) |  |
35 KB | Floresaa | 2D slice of HPCA H+ distribution for 1 spin showing energy and angle bins. The x axis is parallel to the magnetic field and the y axis is defined by the bulk velocity (V_bulk is within the plane). | 1 |
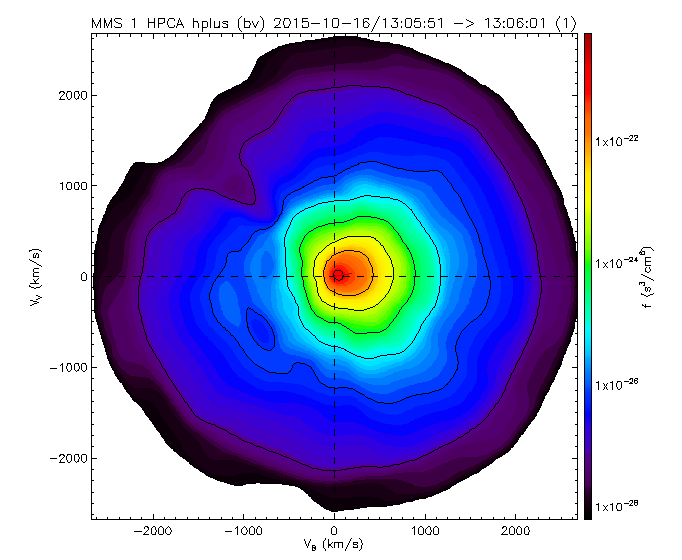
| 23:08, 27 May 2016 | Hpca slice contour.png (file) |  |
36 KB | Floresaa | Contoured 2D slice of HPCA H+ distribution for 1 spin. The x axis is parallel to the magnetic field and the y axis is defined by the bulk velocity (V_bulk is within the plane). | 1 |
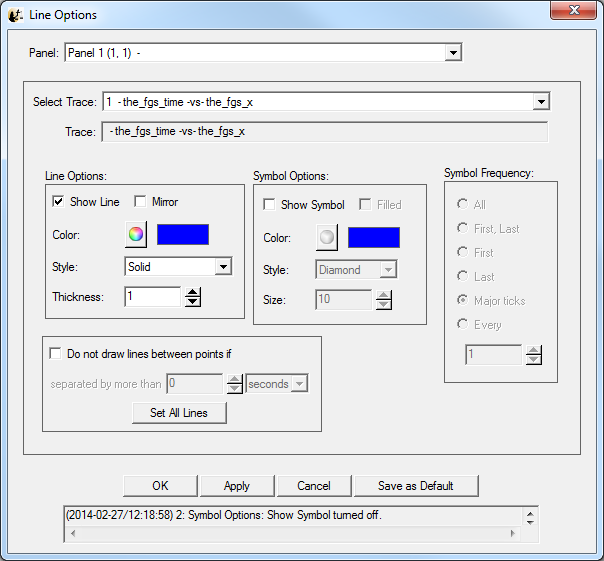
| 21:54, 27 February 2014 | Line options.png (file) |  |
36 KB | Egrimes | Line Options | 1 |
| 23:14, 12 February 2018 | Win10 problem.PNG (file) |  |
37 KB | Nikos | Example with graphics problems on Windows 10. To correct this, run the IDL executable file in "Windows 8 compatibility" mode. | 1 |
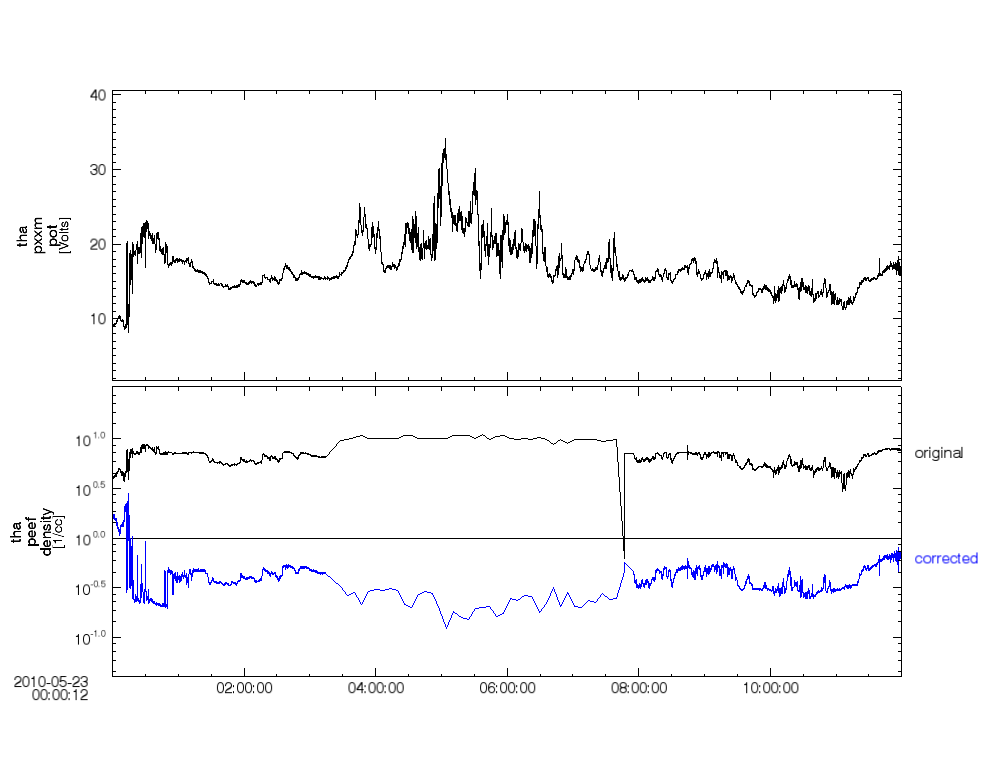
| 21:48, 21 May 2015 | Pot dens compare.png (file) |  |
38 KB | Floresaa | Spacecraft potential with corrected and uncorrected density data. | 1 |
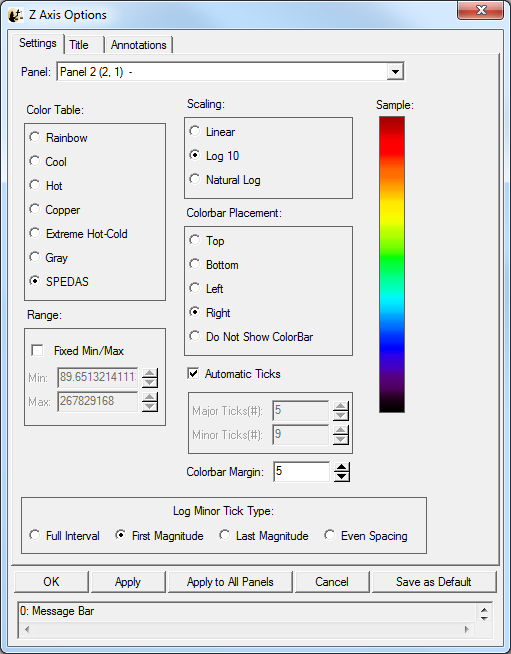
| 22:37, 27 February 2014 | Zaxis options settings.png (file) |  |
38 KB | Egrimes | Z-axis options | 1 |
| 19:22, 12 July 2016 | MMS EDP quicklook.png (file) |  |
39 KB | Floresaa | MMS1 EDP quicklook DCE data. | 1 |
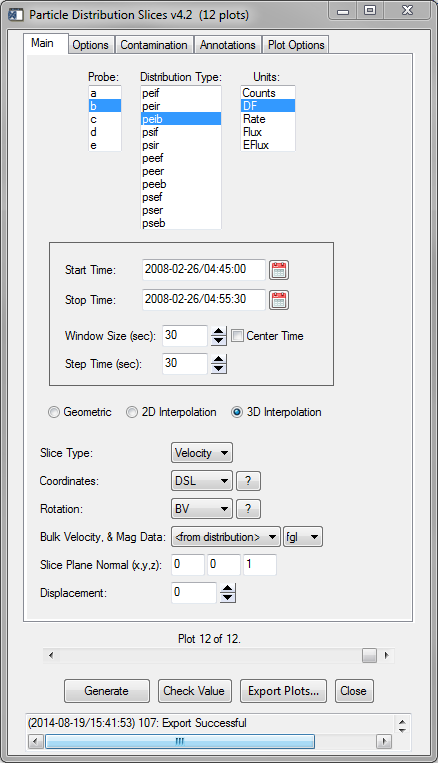
| 23:38, 19 August 2014 | Thm slice2d gui.PNG (file) |  |
39 KB | Floresaa | Graphical interface for generating and plotting particle distribution slices. | 1 |
| 15:25, 9 May 2018 | 3.6.10a.png (file) |  |
40 KB | Clrussell | 2 |