File list
Jump to navigation
Jump to search
This special page shows all uploaded files.
| Date | Name | Thumbnail | Size | User | Description | Versions |
|---|---|---|---|---|---|---|
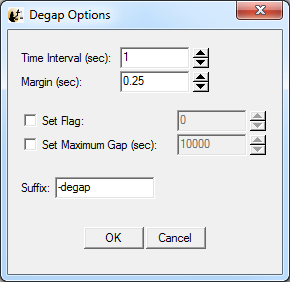
| 22:18, 27 February 2014 | Dproc degap options.png (file) |  |
14 KB | Egrimes | Degap data | 1 |
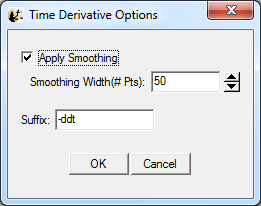
| 22:18, 27 February 2014 | Dproc derivative.png (file) |  |
11 KB | Egrimes | Find the time derivative of a time series | 1 |
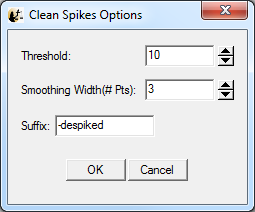
| 22:17, 27 February 2014 | Dproc despike options.png (file) |  |
11 KB | Egrimes | Clean spikes from data | 1 |
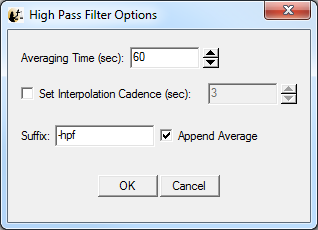
| 22:16, 27 February 2014 | Dproc high pass filter options.png (file) |  |
14 KB | Egrimes | High pass filter | 1 |
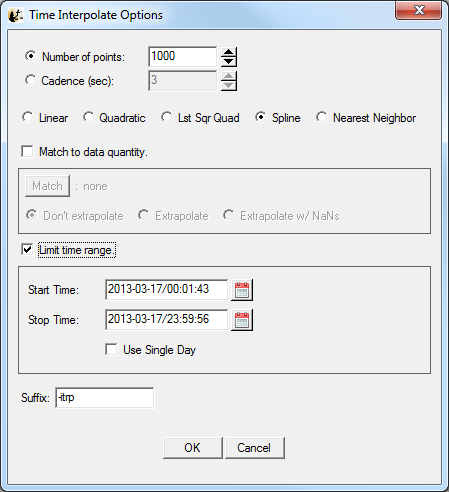
| 22:16, 27 February 2014 | Dproc interpolation options.png (file) |  |
27 KB | Egrimes | Interpolation of data | 1 |
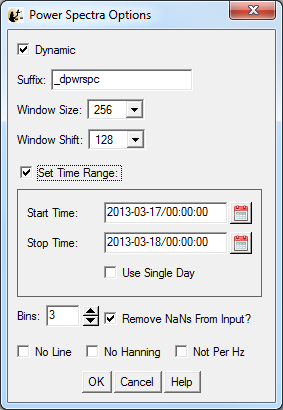
| 22:15, 27 February 2014 | Dproc power spectra.png (file) |  |
19 KB | Egrimes | Power spectra calculations | 1 |
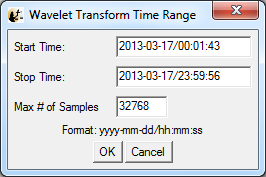
| 22:15, 27 February 2014 | Dproc wavelet transform.png (file) |  |
13 KB | Egrimes | Wavelet transforms | 1 |
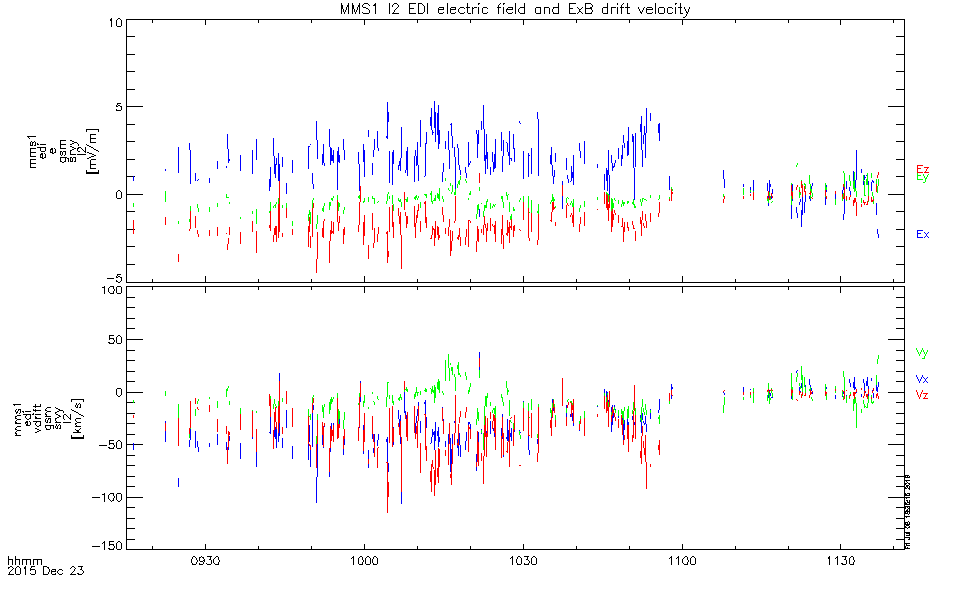
| 02:05, 9 July 2016 | EDI l2.png (file) |  |
14 KB | Floresaa | MMS1 l2 EDI electric field and ExB drift velocity. | 1 |
| 02:15, 9 July 2016 | EDI overview.png (file) |  |
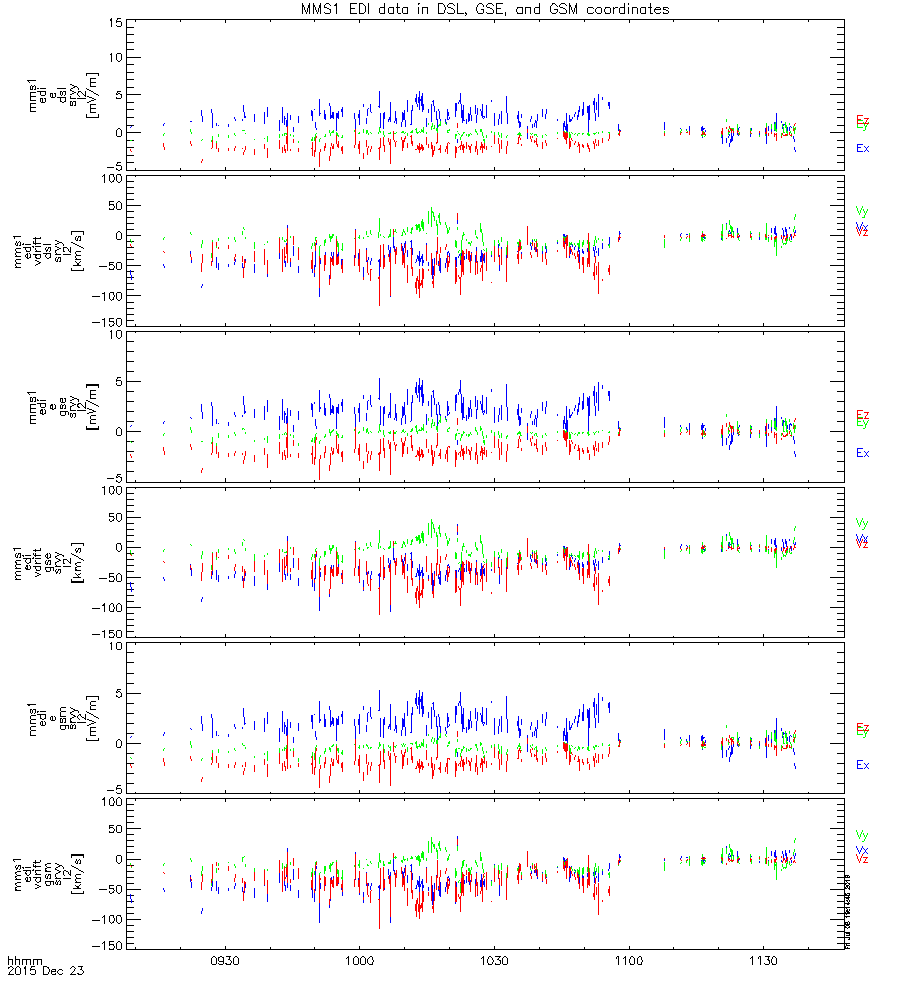
32 KB | Floresaa | MMS1 l2 EDI data in DSL, GSE, and GSM coordinates. | 1 |
| 02:02, 9 July 2016 | EDI ql.png (file) |  |
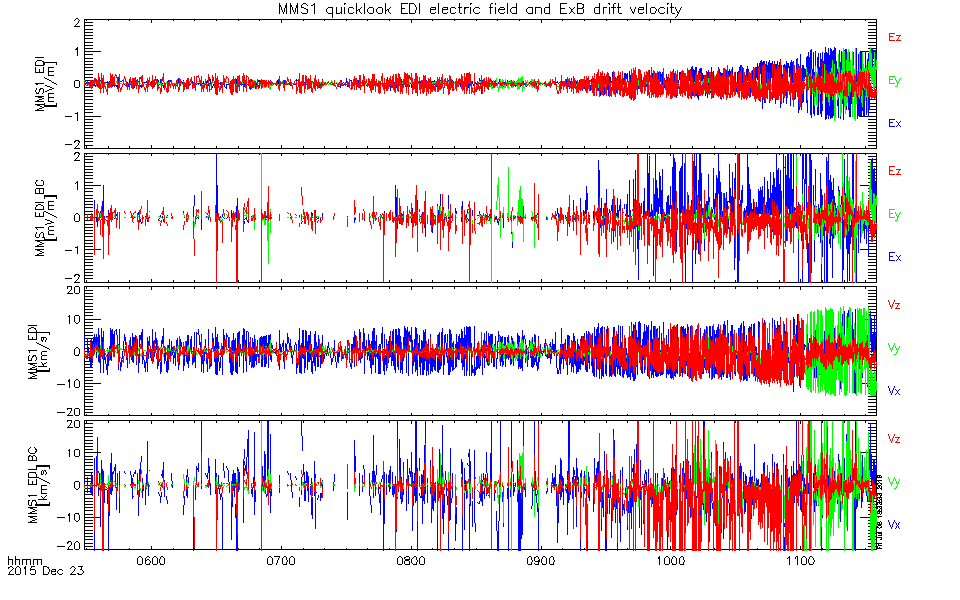
33 KB | Floresaa | MMS1 quicklook EDI electric field and ExB drift velocity - "bestarg" and "beam convergence" methods. | 1 |
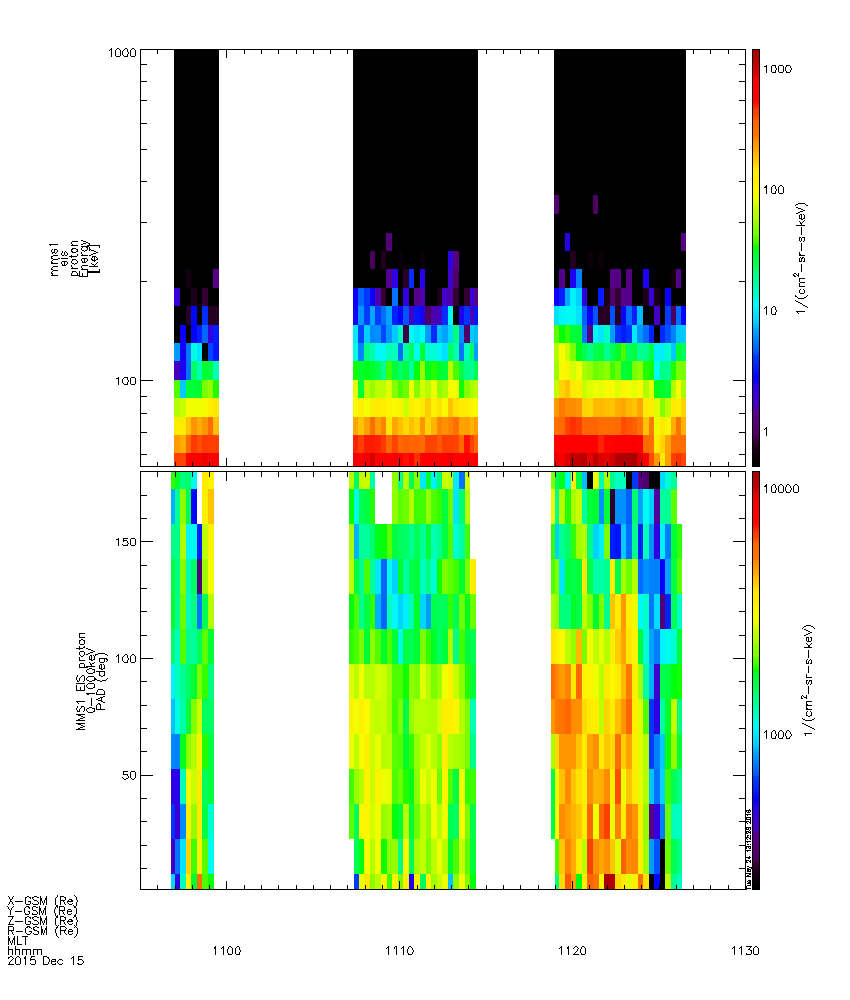
| 20:14, 24 May 2016 | EIS Burst data Plots.png (file) |  |
18 KB | Clrussell | EIS Burst Mode Data, December 15, 2015 | 1 |
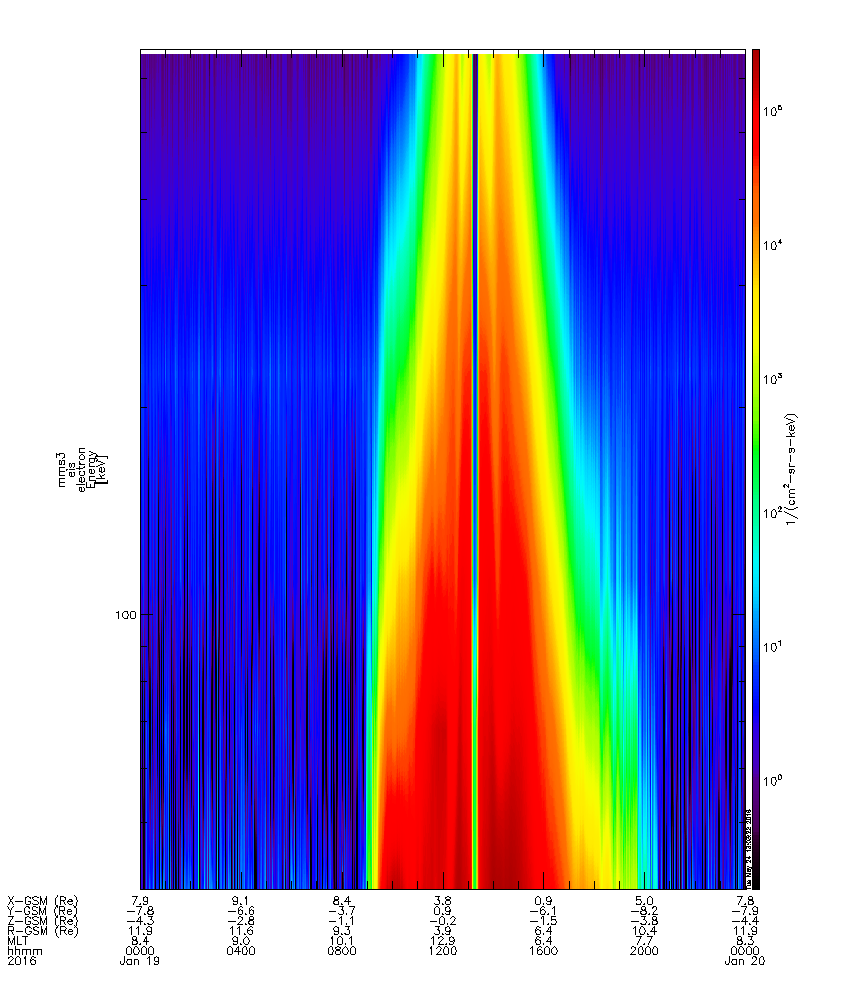
| 20:04, 24 May 2016 | EIS Electron Plots.png (file) |  |
155 KB | Clrussell | EIS Electron Energy Plot | 1 |
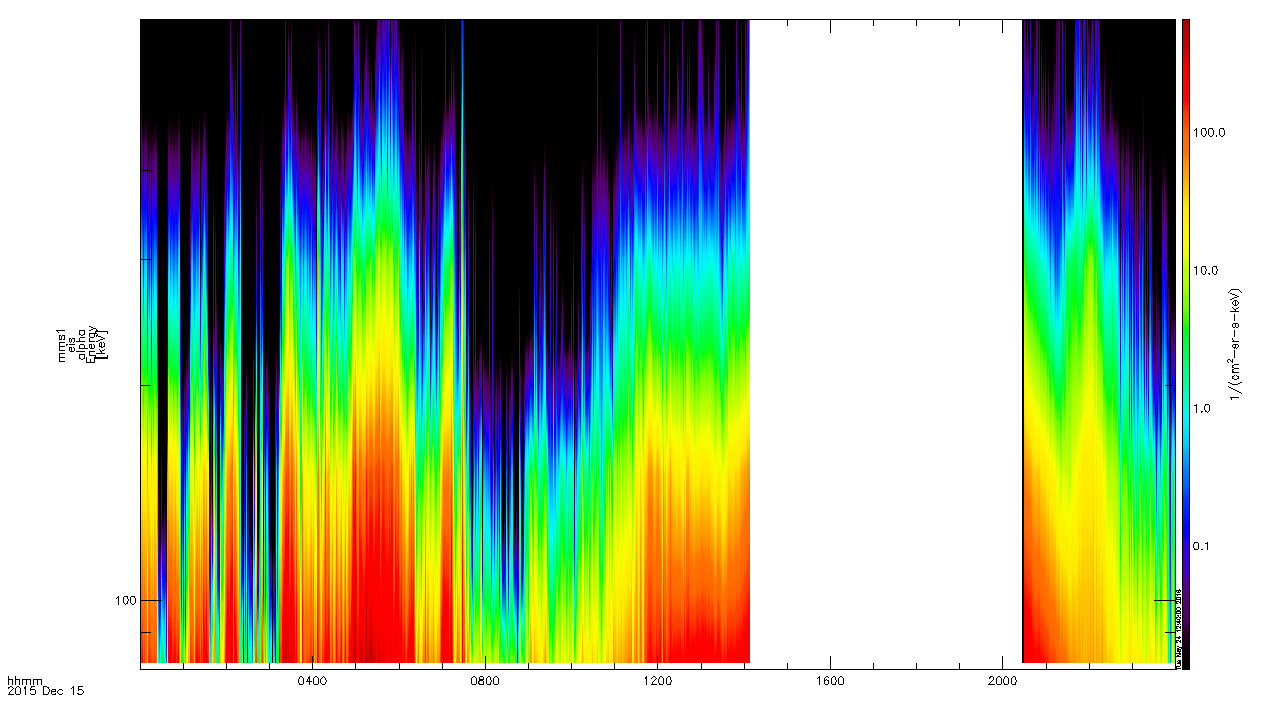
| 19:51, 24 May 2016 | EIS Heplusplus Plots.png (file) |  |
241 KB | Clrussell | EIS He++ Flux, all channels, December 15, 2015 | 1 |
| 19:52, 24 May 2016 | EIS Hplus Plots.png (file) |  |
203 KB | Clrussell | EIS H+ Flux, all channels, December 15, 2015 | 1 |
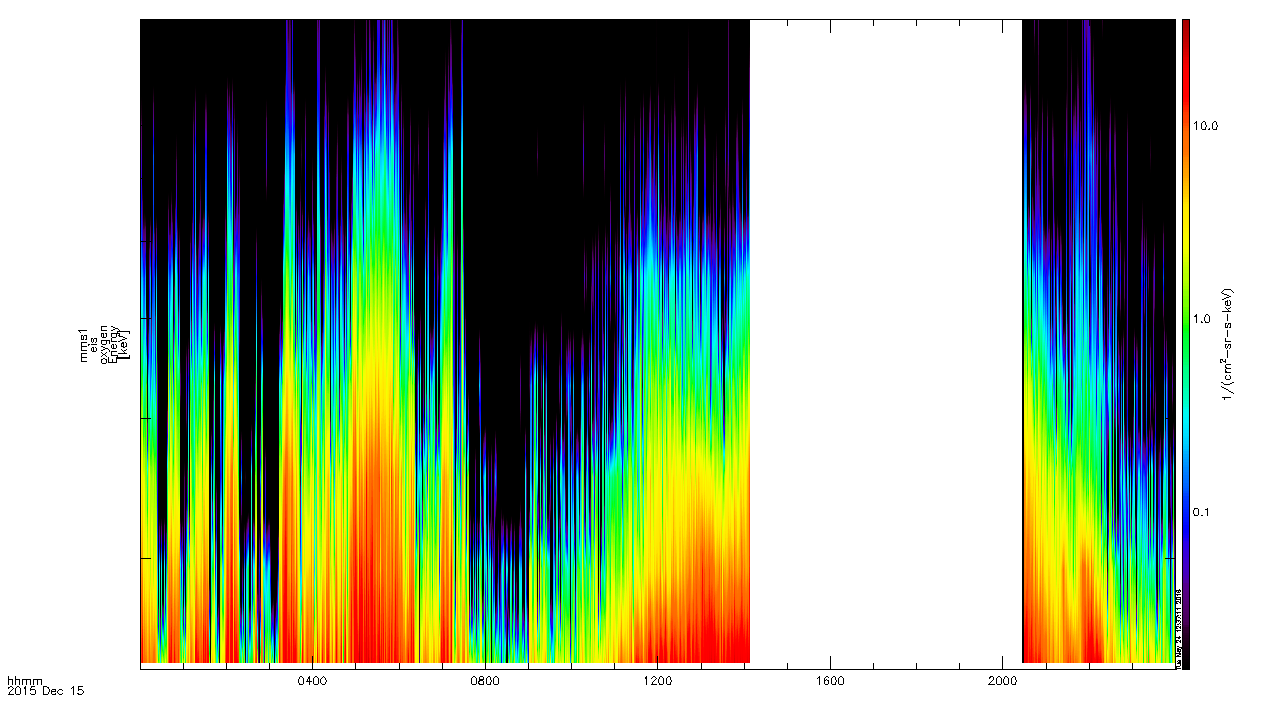
| 19:52, 24 May 2016 | EIS Oplus Plots.png (file) |  |
246 KB | Clrussell | EIS O+ Flux, all channels, December 15, 2015 | 1 |
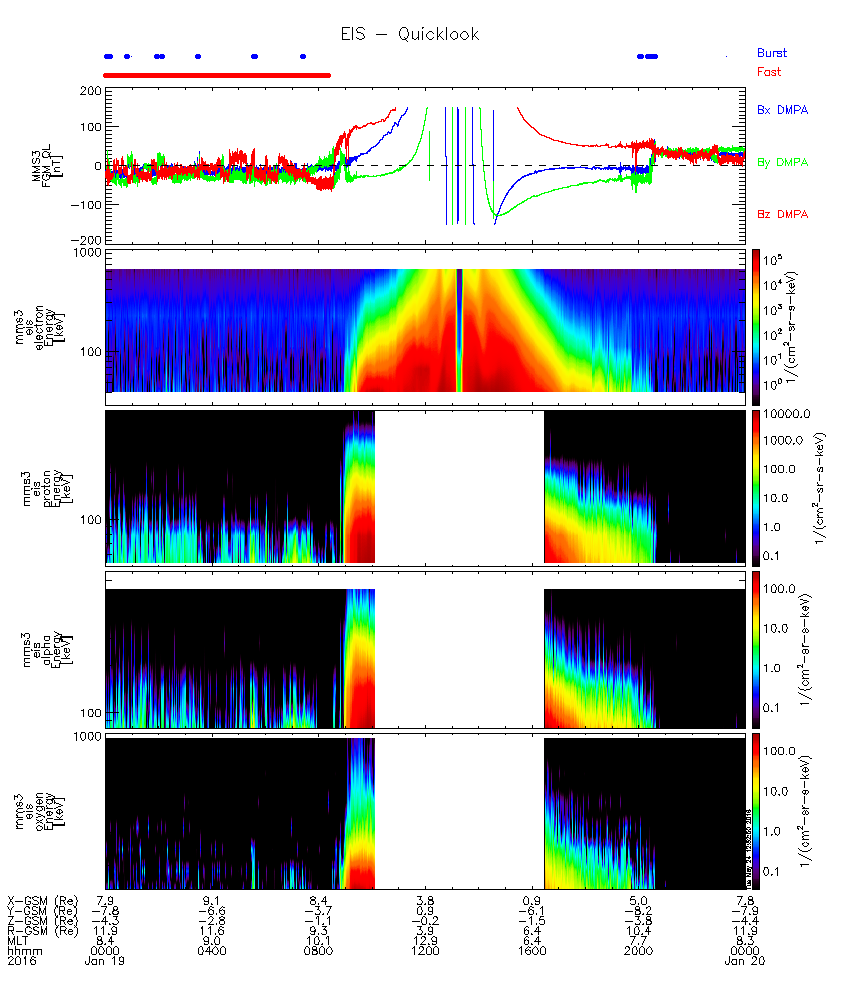
| 20:07, 24 May 2016 | EIS QuickLook Plots.png (file) |  |
196 KB | Clrussell | EIS QuickLook Plots | 2 |
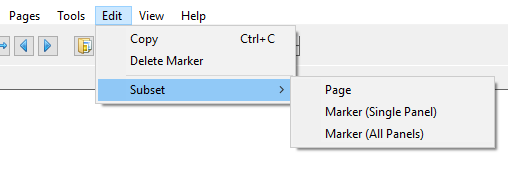
| 22:39, 15 November 2018 | Edit menu gui.png (file) |  |
6 KB | Nikos | Spedas 3.1 | 2 |
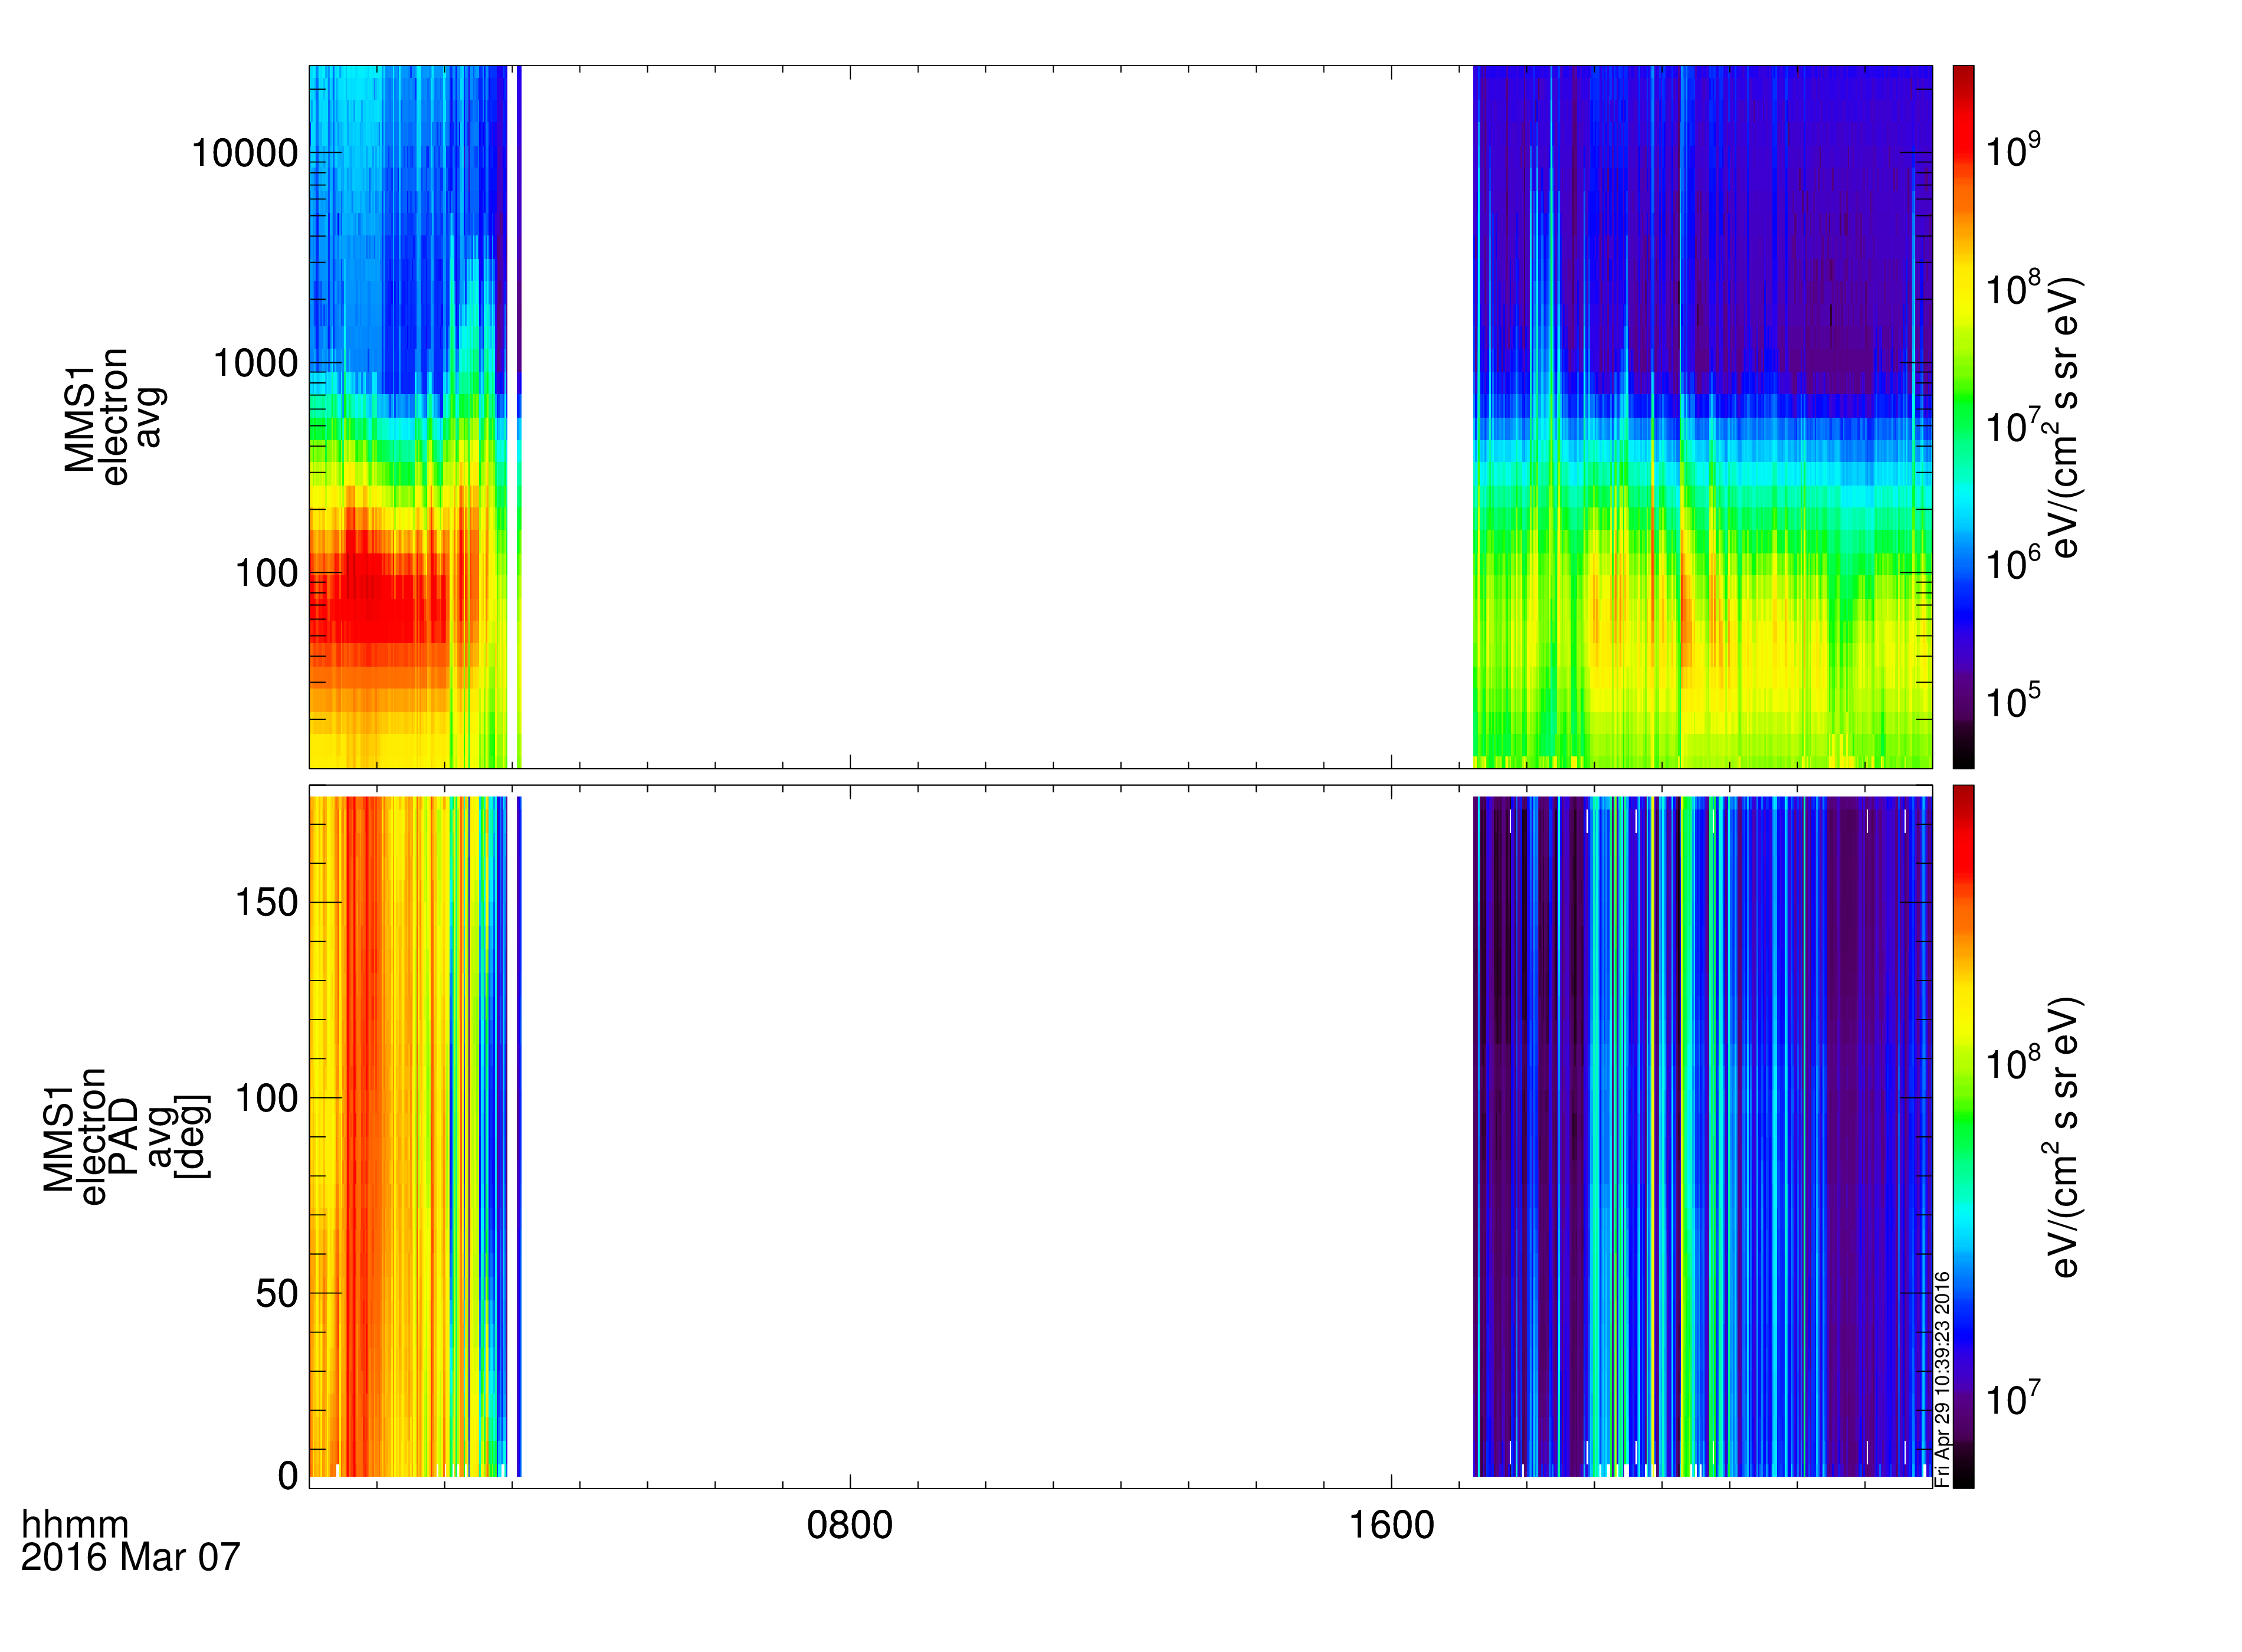
| 17:40, 29 April 2016 | Elec moms.png (file) |  |
219 KB | Egrimes | FPI electron energy spectra and pitch angle distribution on March 7, 2016 | 1 |
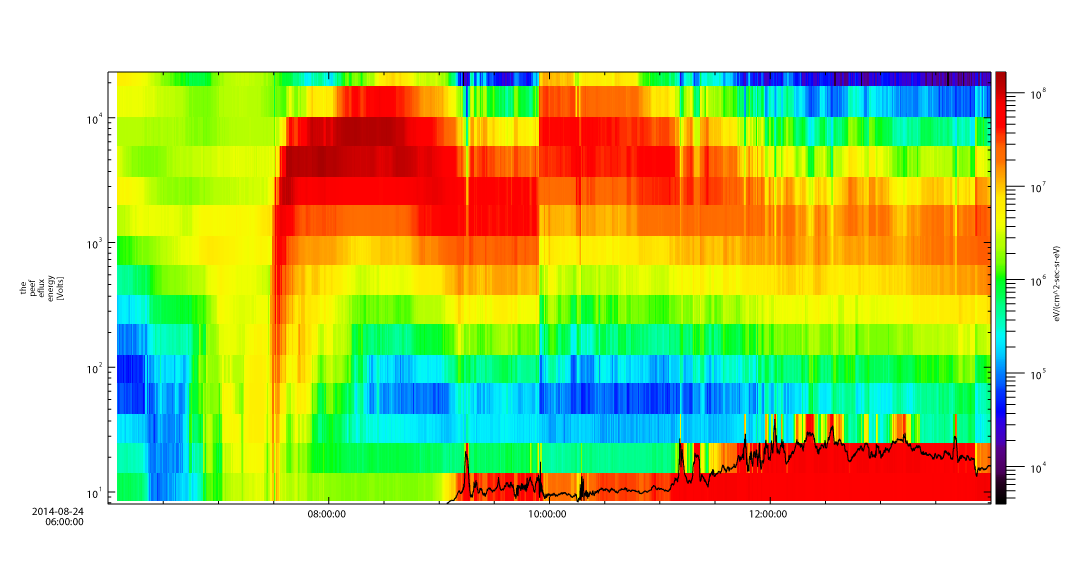
| 00:24, 30 August 2014 | Espec pot.png (file) |  |
50 KB | Floresaa | Energy spectrogram of ESA electron data with overlaid spacecraft potential. | 1 |
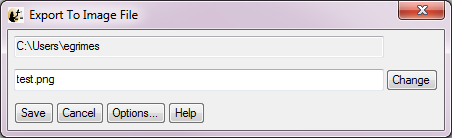
| 16:34, 15 August 2014 | Export to image file.png (file) |  |
13 KB | Egrimes | SPEDAS export to image file | 1 |
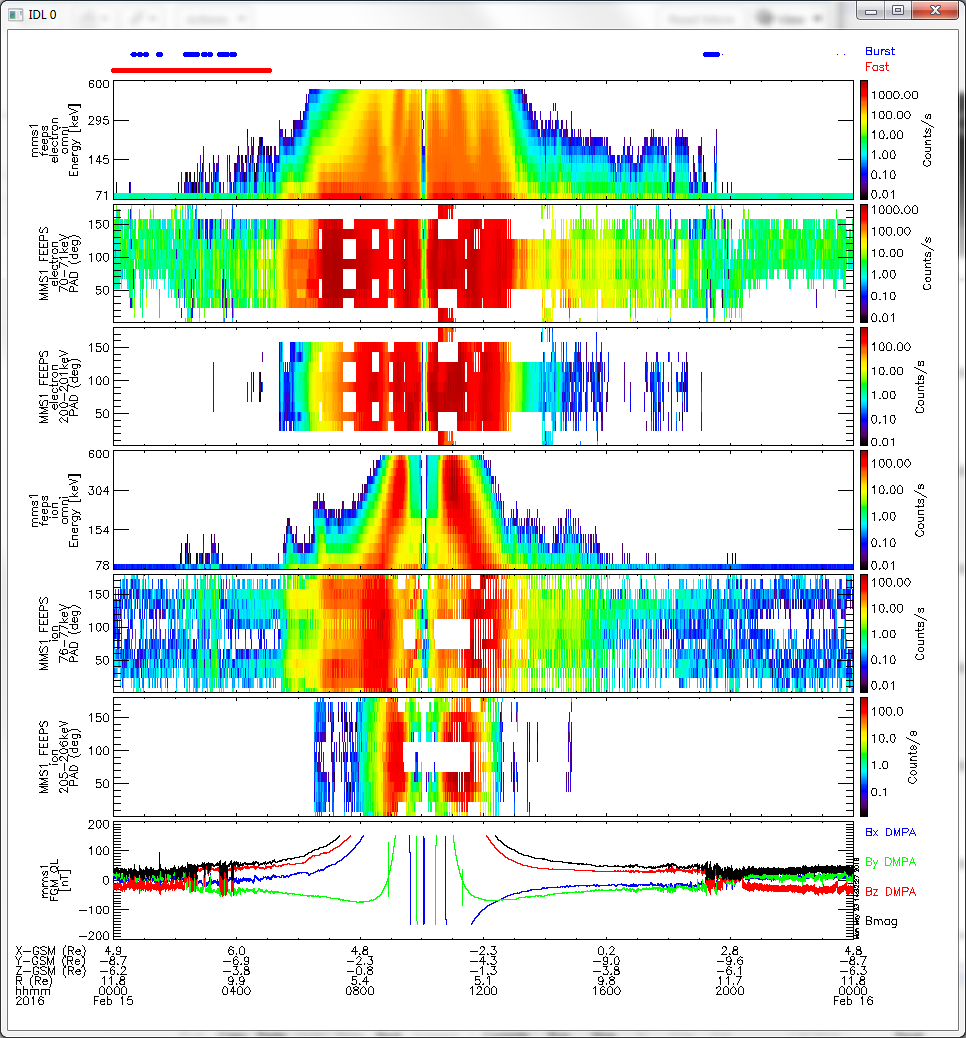
| 22:09, 23 May 2016 | FEEPS Quicklook Plot.png (file) |  |
216 KB | Clrussell | 2 | |
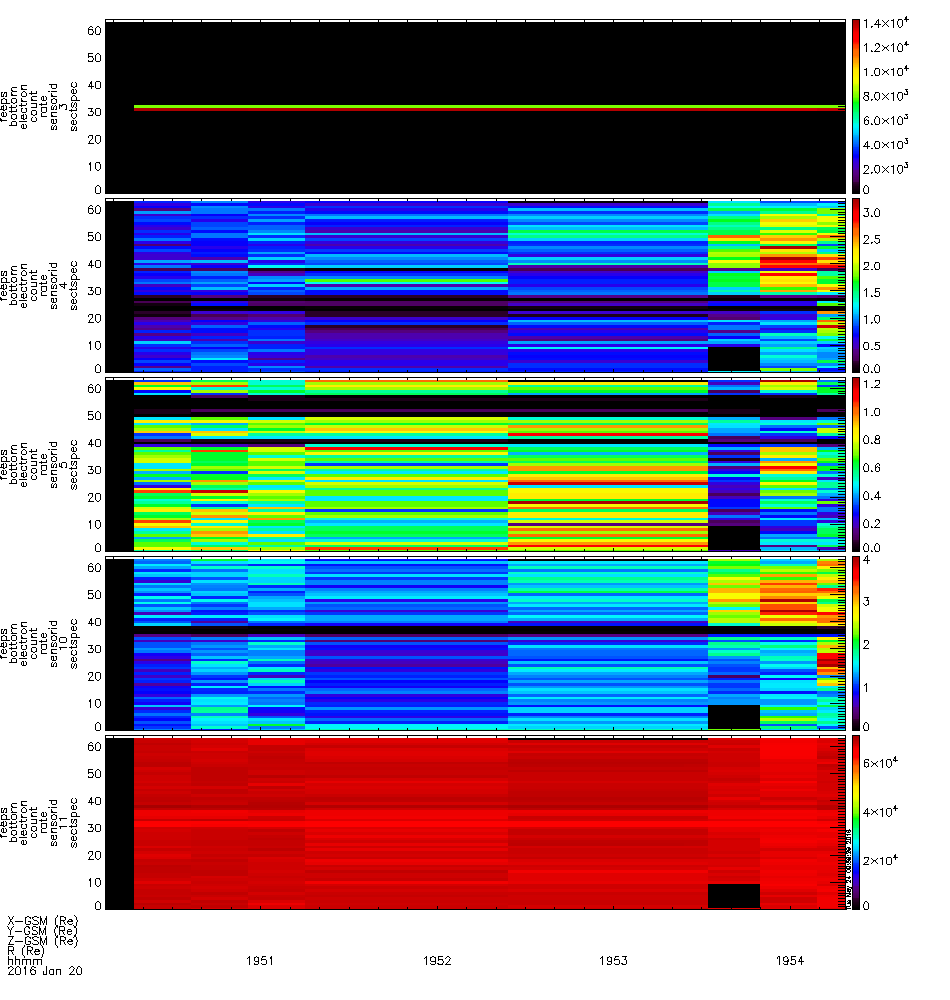
| 17:03, 24 May 2016 | FEEPS Sector Time Spectrograms plot.png (file) |  |
32 KB | Clrussell | MMS FEEPS Data, Sector-Time Spectrogram Plot | 1 |
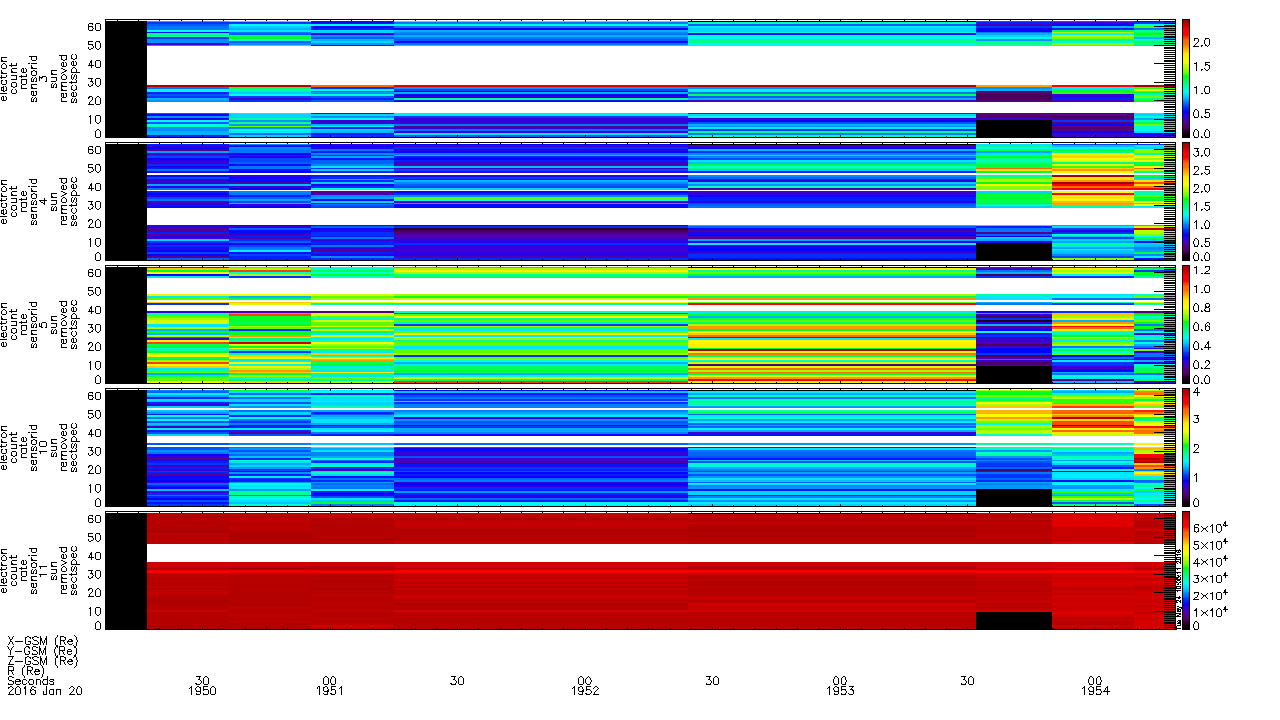
| 17:08, 24 May 2016 | FEEPS Sector Time Spectrograms plot sun removed.png (file) |  |
30 KB | Clrussell | FEEPS Sector-Time Spectrograms with Sun Contamination Removed | 1 |
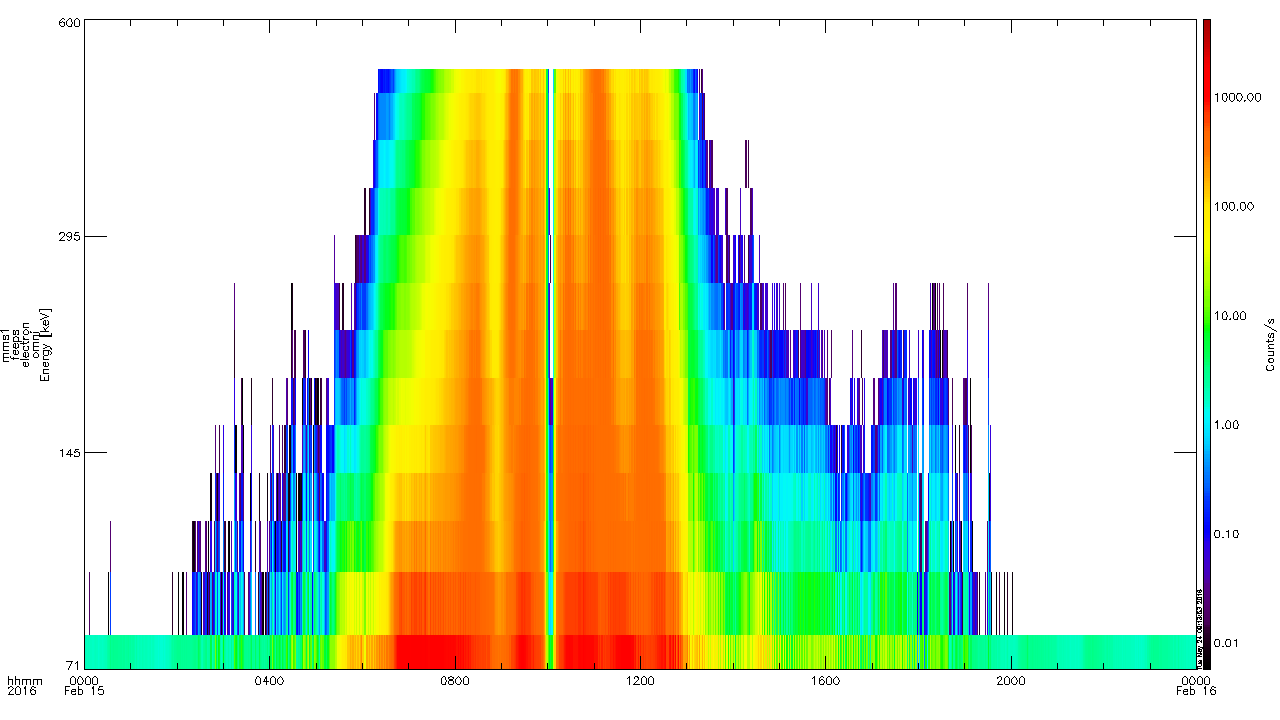
| 16:17, 24 May 2016 | FEEPS electron omni spin plot.png (file) |  |
21 KB | Clrussell | FEEPS Electron Omni Spin Data | 1 |
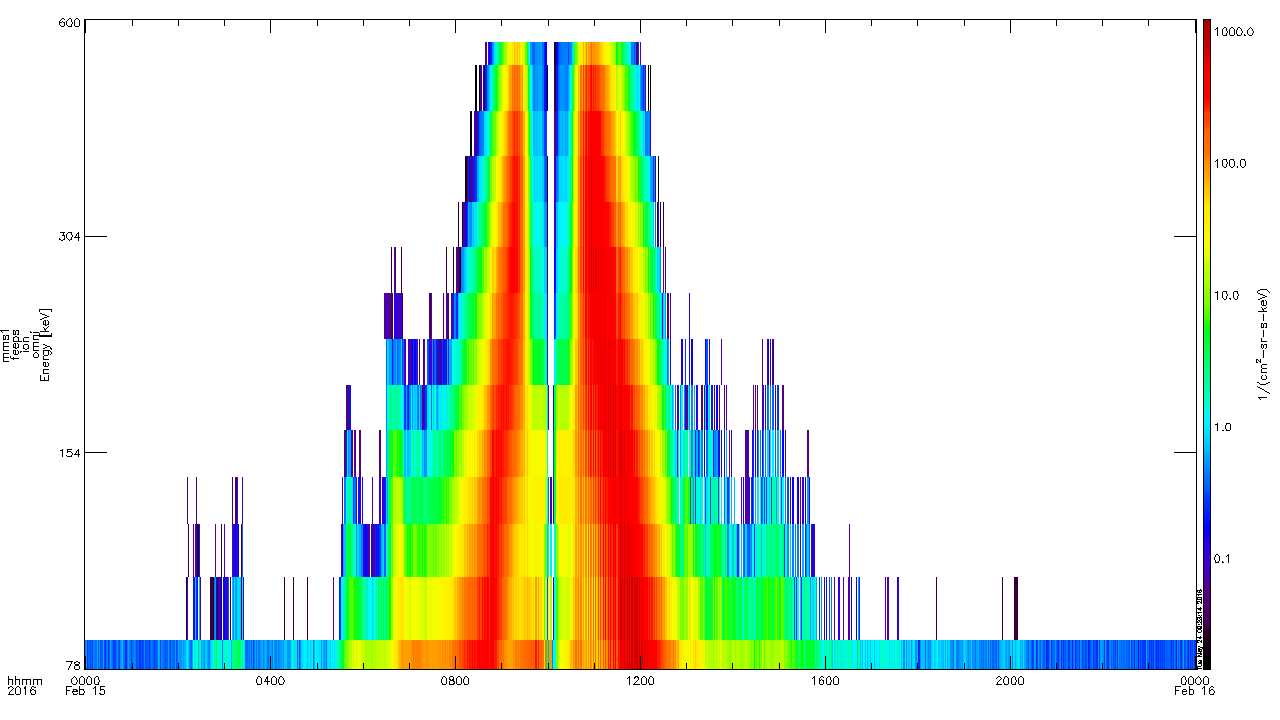
| 16:24, 24 May 2016 | FEEPS ion omni spin plot.png (file) |  |
18 KB | Clrussell | FEEPS Ion Omni Spin Data plot | 1 |
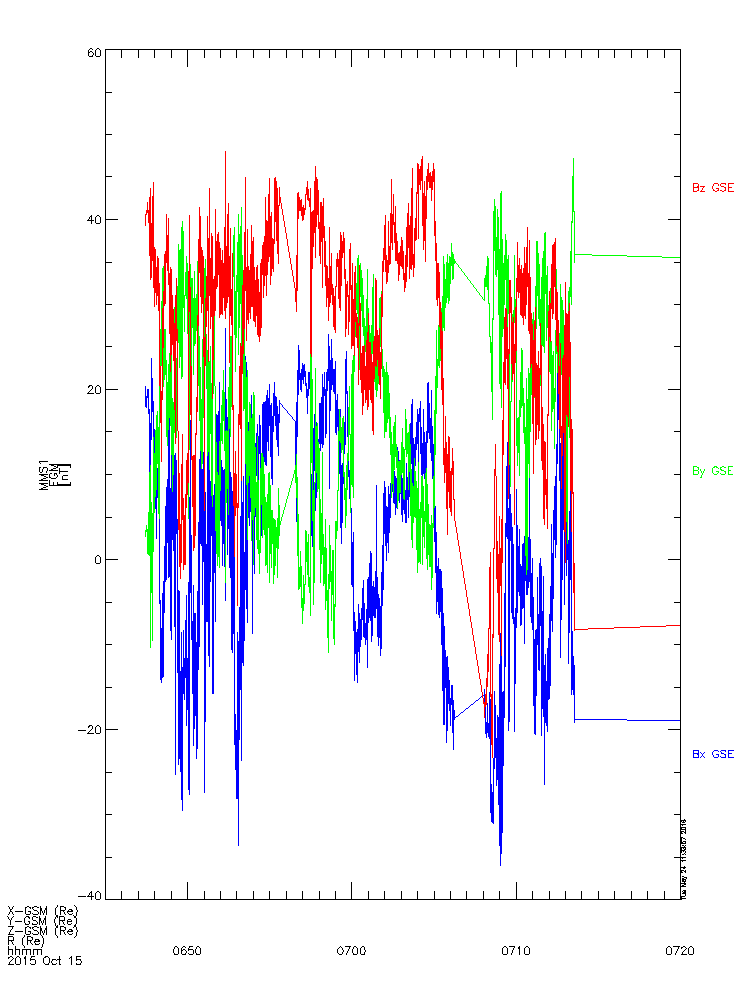
| 18:36, 24 May 2016 | FGM Burst Data Plots.png (file) |  |
15 KB | Clrussell | MMS Flux Gate Magnetometer Burst Data, October 15, 2015 | 1 |
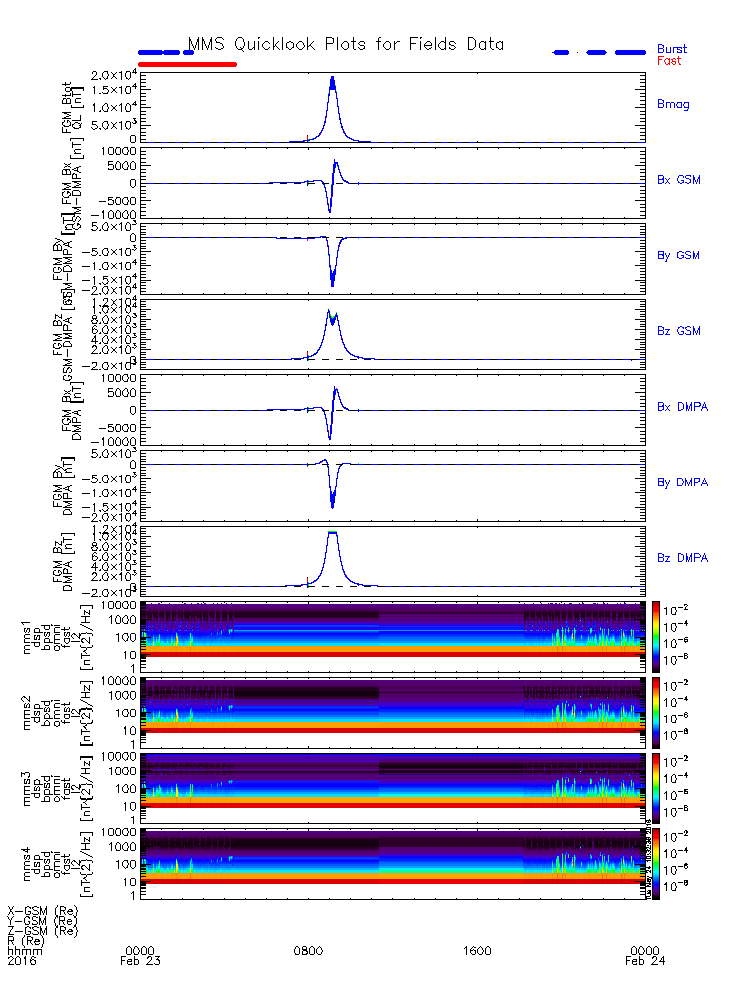
| 18:14, 24 May 2016 | FGM QuickLook Plots.png (file) |  |
81 KB | Clrussell | Flux Gate Magnetometer Quick Look Plots | 1 |
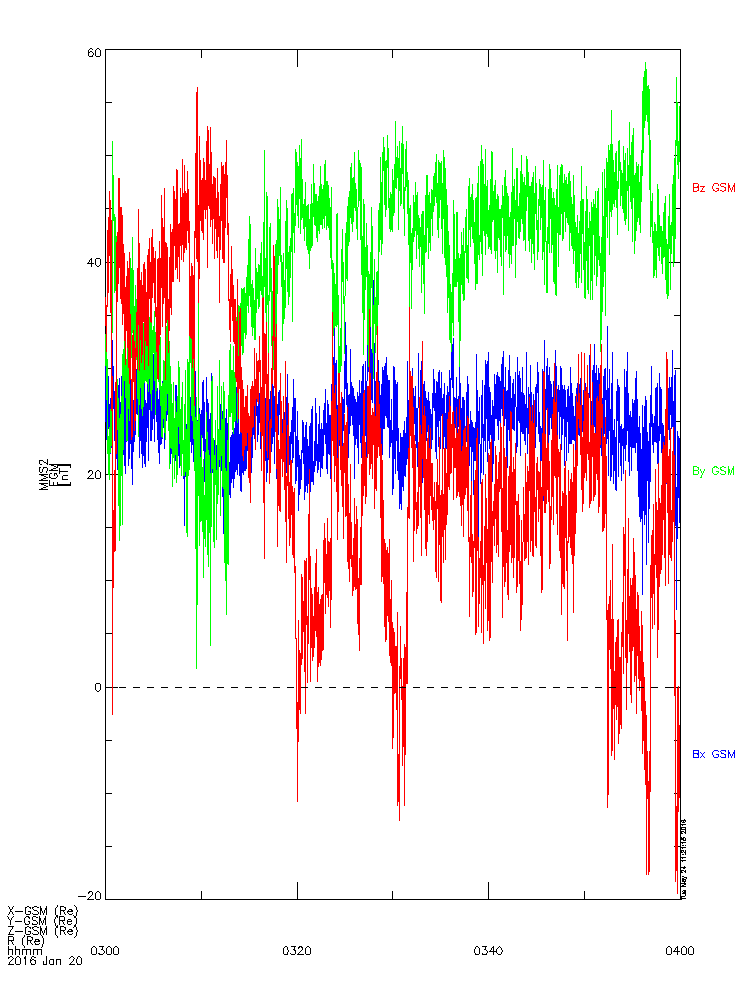
| 18:25, 24 May 2016 | FGM Survey Data Plots.png (file) |  |
16 KB | Clrussell | Flux Gate Magnetometer Plot, February 15, 2016 | 1 |
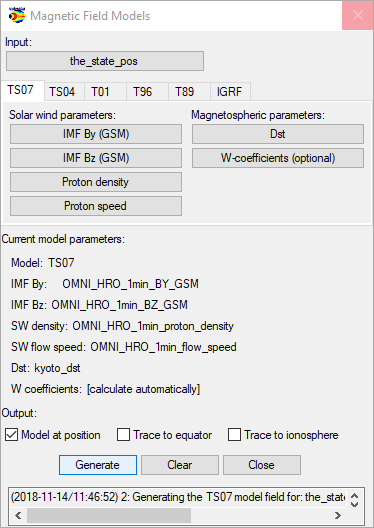
| 19:48, 14 November 2018 | Field models panel populated.png (file) |  |
19 KB | Nikos | Spedas 3.1 | 2 |
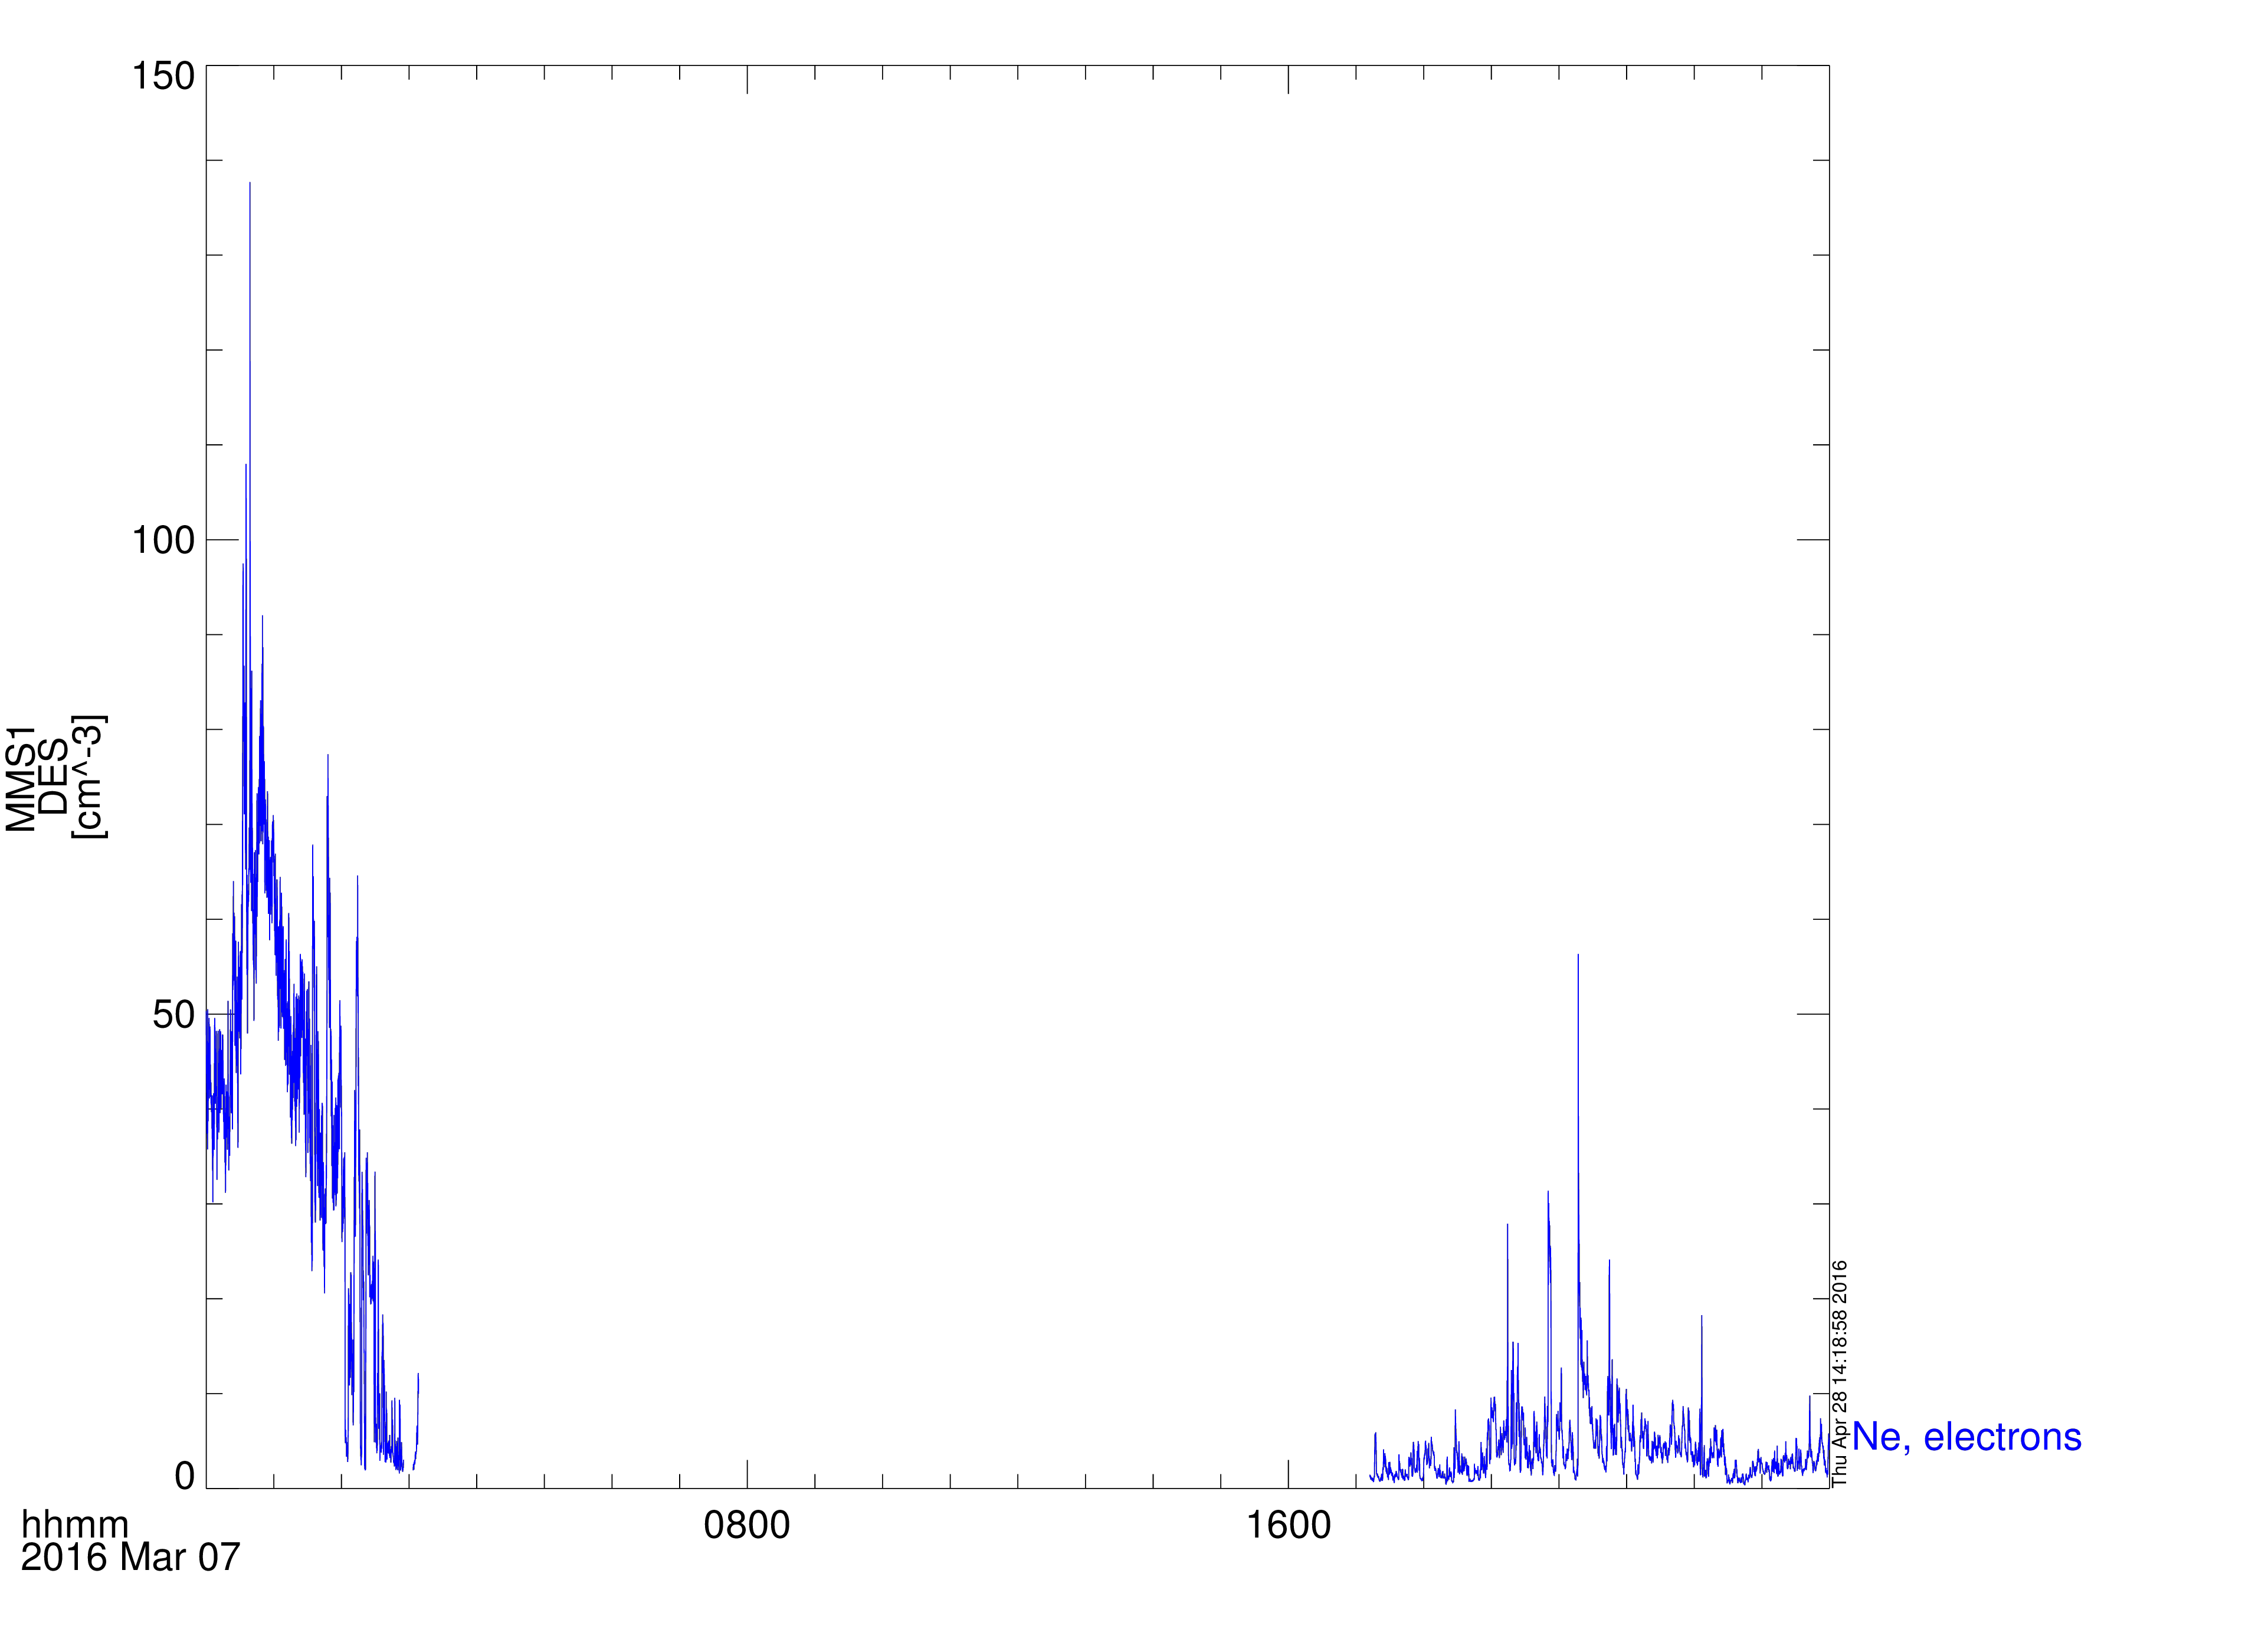
| 21:21, 28 April 2016 | Fpi electron density2.png (file) |  |
113 KB | Egrimes | FPI electron density on March 7, 2016 | 1 |
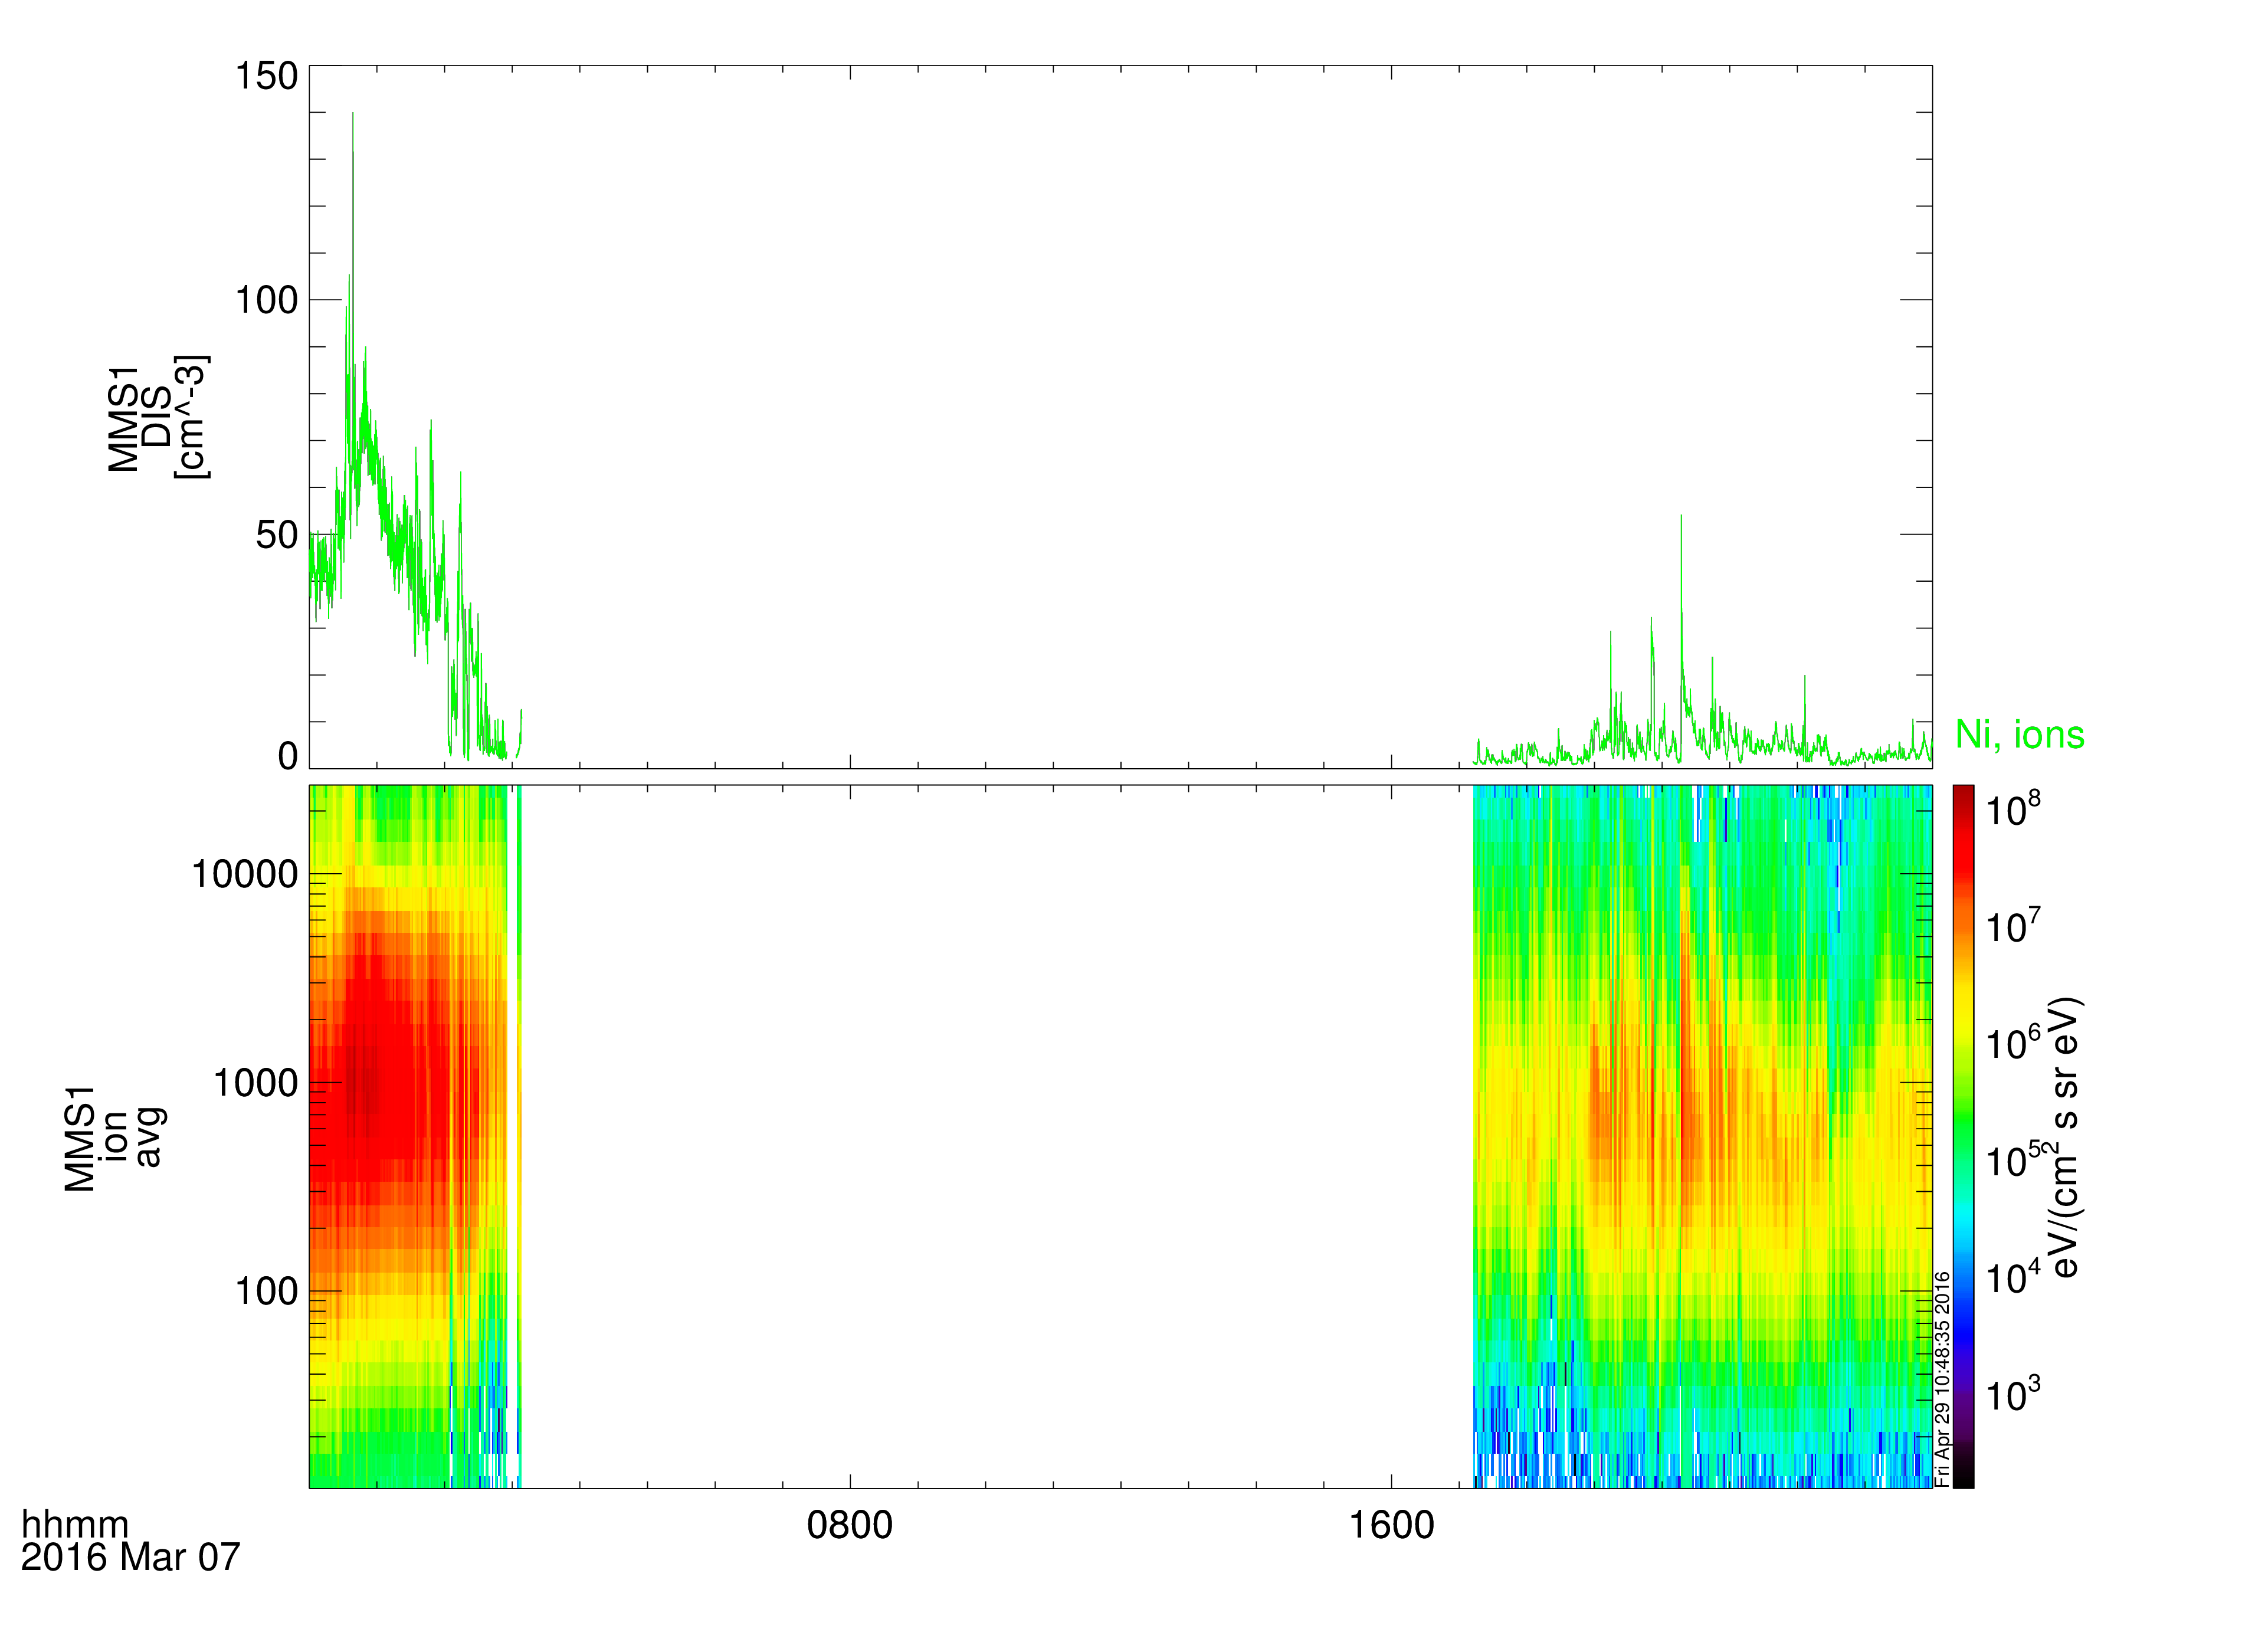
| 17:50, 29 April 2016 | Fpi ion moms.png (file) |  |
196 KB | Egrimes | FPI ion data on March 7, 2016 | 1 |
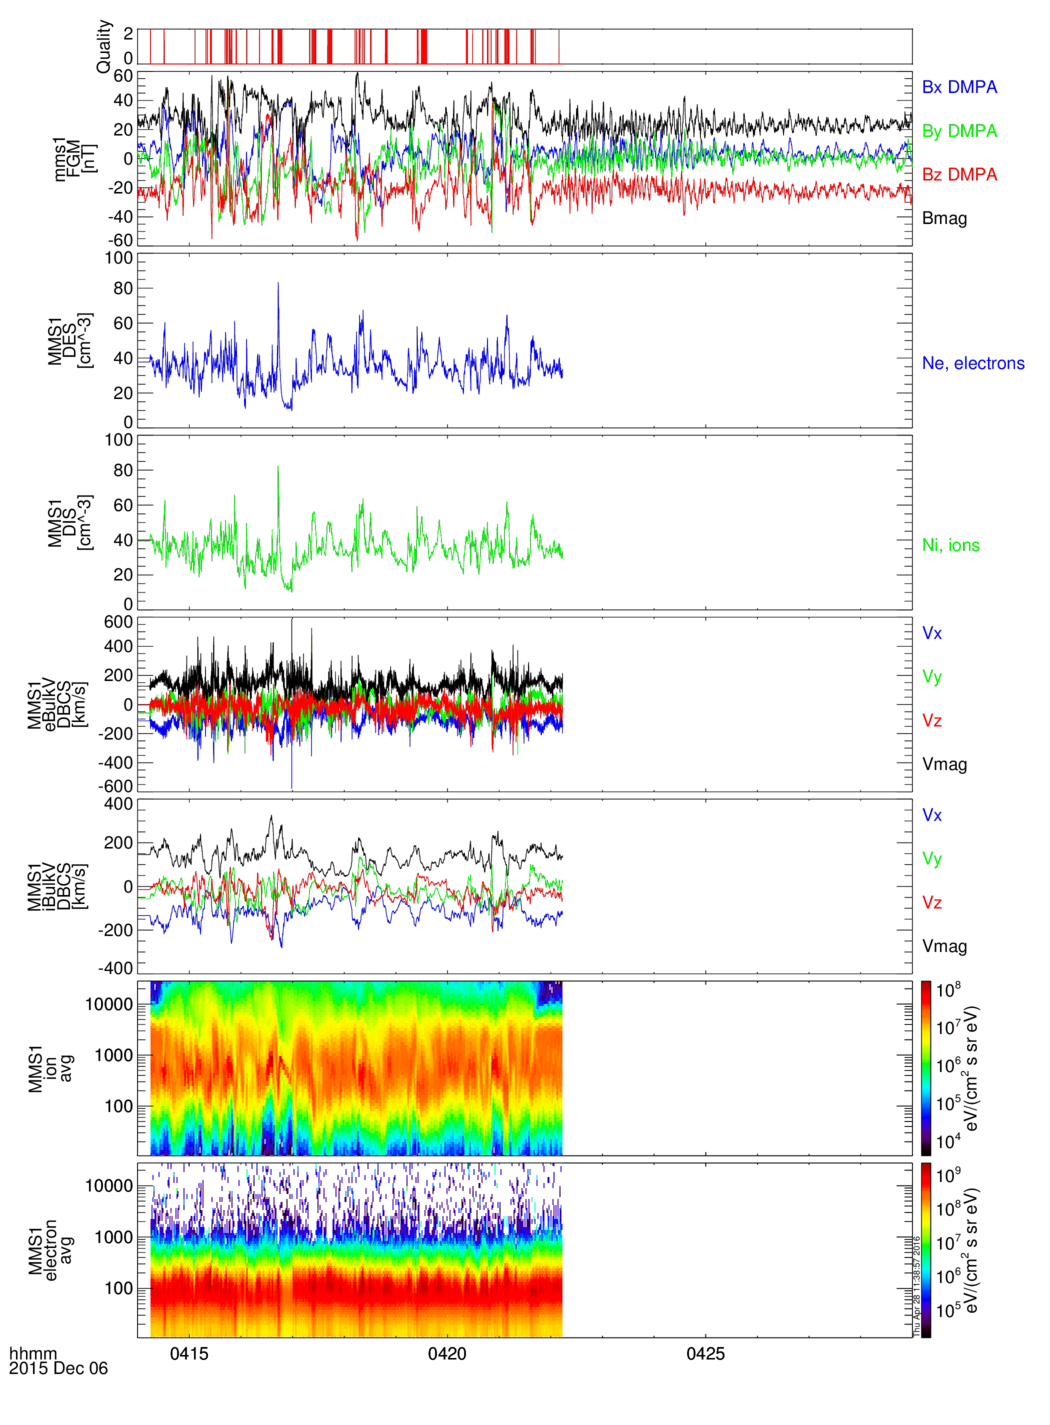
| 18:53, 28 April 2016 | Fpi summary plot2.png (file) |  |
639 KB | Egrimes | FPI summary plot for MMS1 | 1 |
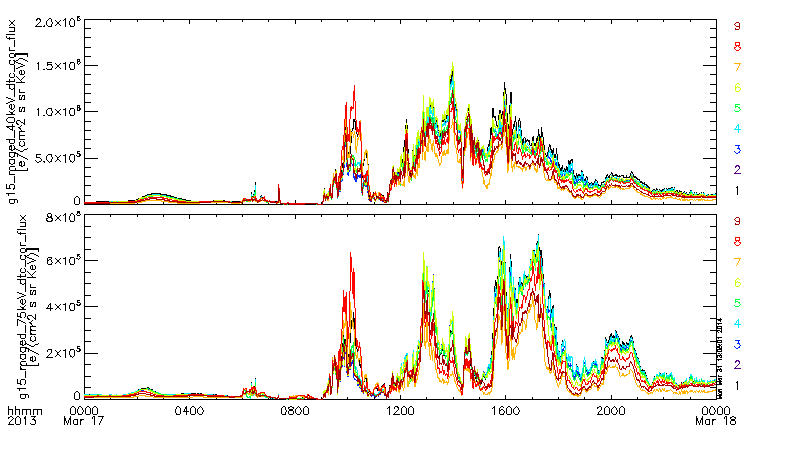
| 20:08, 31 March 2014 | Goes15 maged example.png (file) |  |
24 KB | Egrimes | GOES-15 MAGED data at 40 keV, 75 keV | 1 |
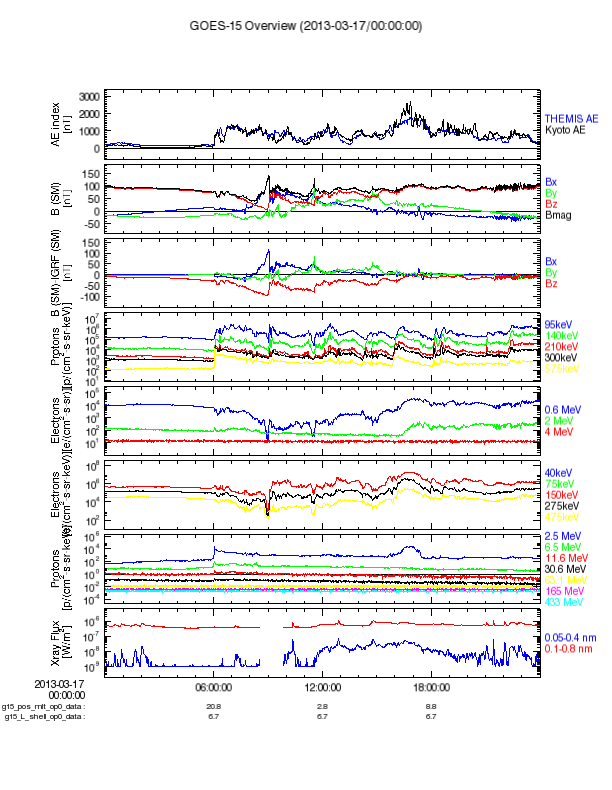
| 16:26, 31 March 2014 | Goes15 overview plot.png (file) |  |
72 KB | Egrimes | GOES-15 overview plot | 1 |
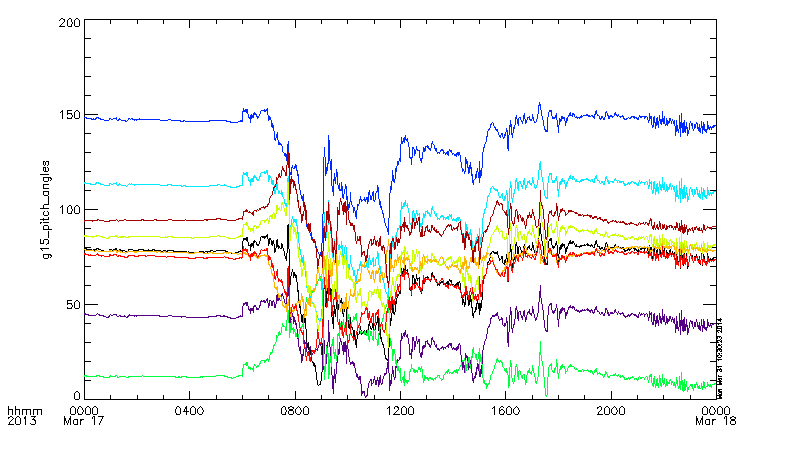
| 17:37, 31 March 2014 | Goes15 pitch angles.png (file) |  |
21 KB | Egrimes | GOES-15 pitch angles on March 17, 2013 | 1 |
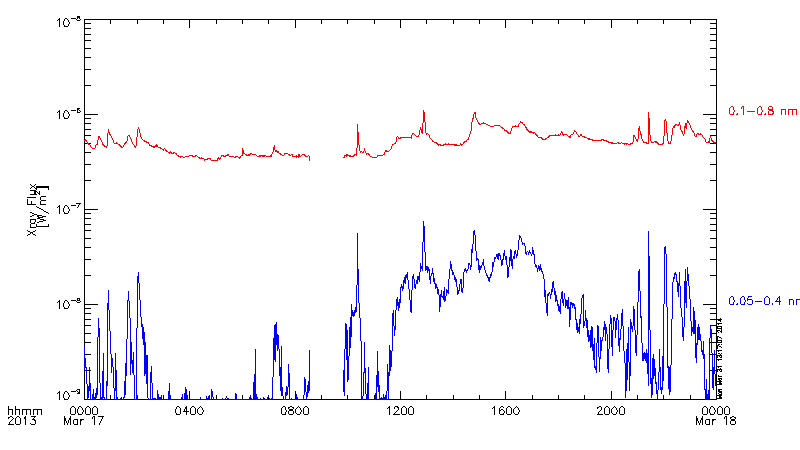
| 20:18, 31 March 2014 | Goes15 xray flux.png (file) |  |
8 KB | Egrimes | GOES-15 X-ray flux on March 17, 2013 | 1 |
| 21:30, 15 August 2018 | Goes goes13 20170101 0024.png (file) |  |
26 KB | Nikos | Example of GOES summary plot | 1 |
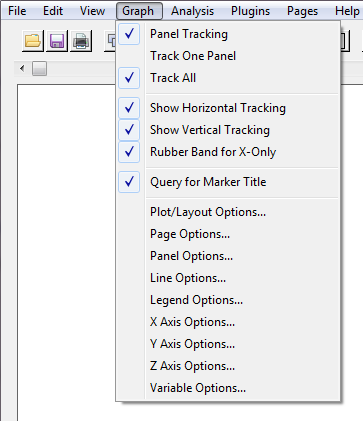
| 16:22, 22 August 2014 | Graph menu gui.png (file) |  |
16 KB | Egrimes | SPEDAS Graph Menu | 1 |
| 22:47, 15 November 2018 | Graph menu s.PNG (file) |  |
11 KB | Nikos | Spedas 3.1 | 2 |
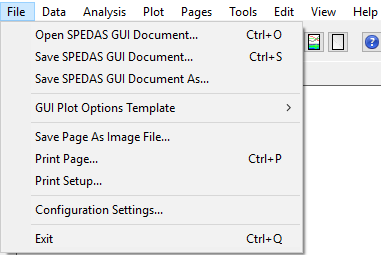
| 20:30, 14 November 2018 | Gui file menu.png (file) |  |
9 KB | Nikos | Spedas 3.1 | 2 |
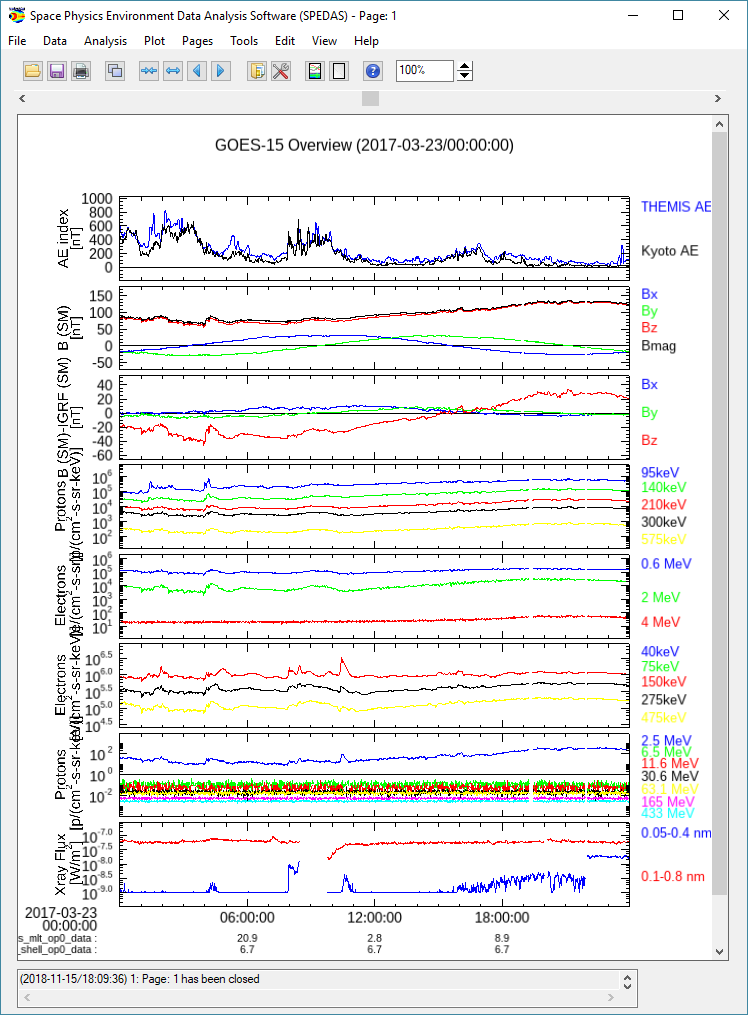
| 02:14, 16 November 2018 | Gui goes overview plot.png (file) |  |
126 KB | Nikos | Spedas 3.1 | 3 |
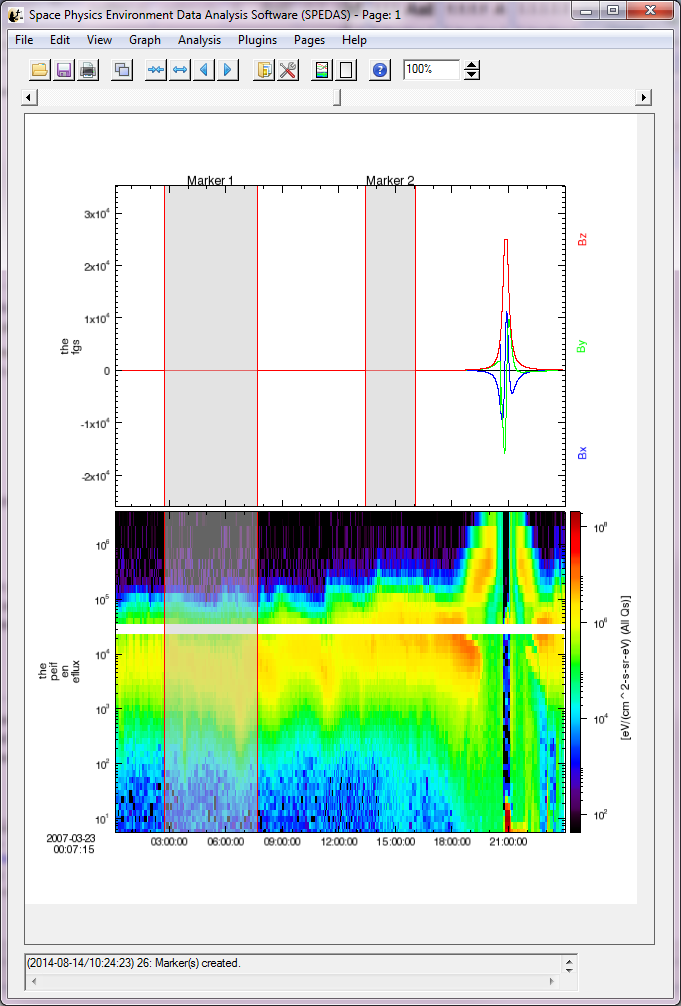
| 17:25, 14 August 2014 | Gui markers.png (file) |  |
122 KB | Egrimes | 1 | |
| 00:05, 9 April 2016 | Help menu s.png (file) |  |
2 KB | Nikos | Help menu | 1 |
| 23:50, 25 March 2022 | High dpi settings.PNG (file) |  |
48 KB | Jwl | High DPI settings under Windows Compatibility settings | 1 |
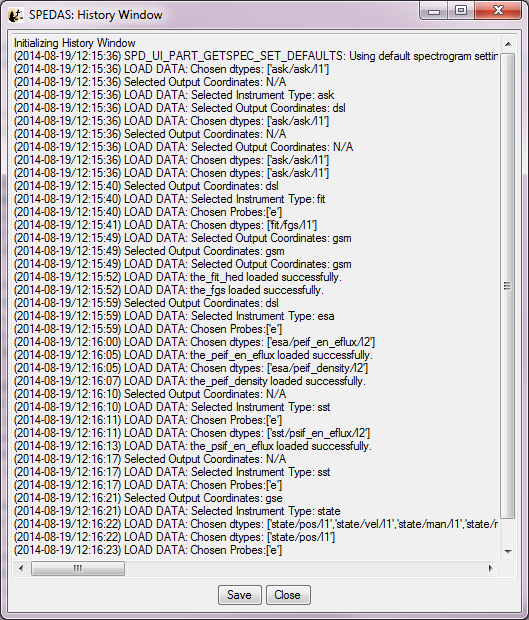
| 19:17, 19 August 2014 | History window gui.png (file) |  |
76 KB | Egrimes | SPEDAS history window | 1 |
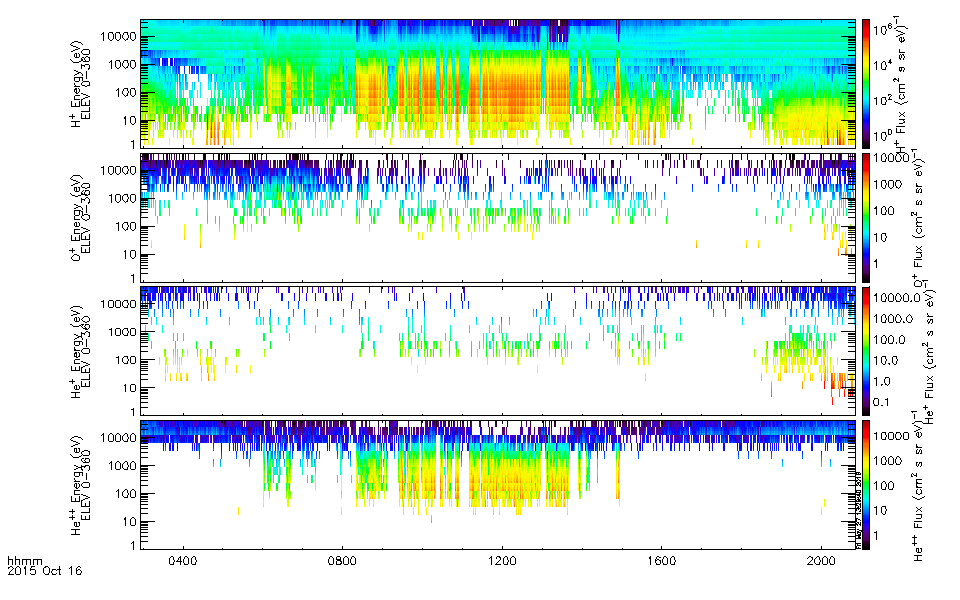
| 22:57, 27 May 2016 | Hpca espec.png (file) |  |
120 KB | Floresaa | Example of HPCA ion energy spectra available from mms_load_hpca. Displayed: H+, O+, He+, and He++ energy spectrograms. | 1 |
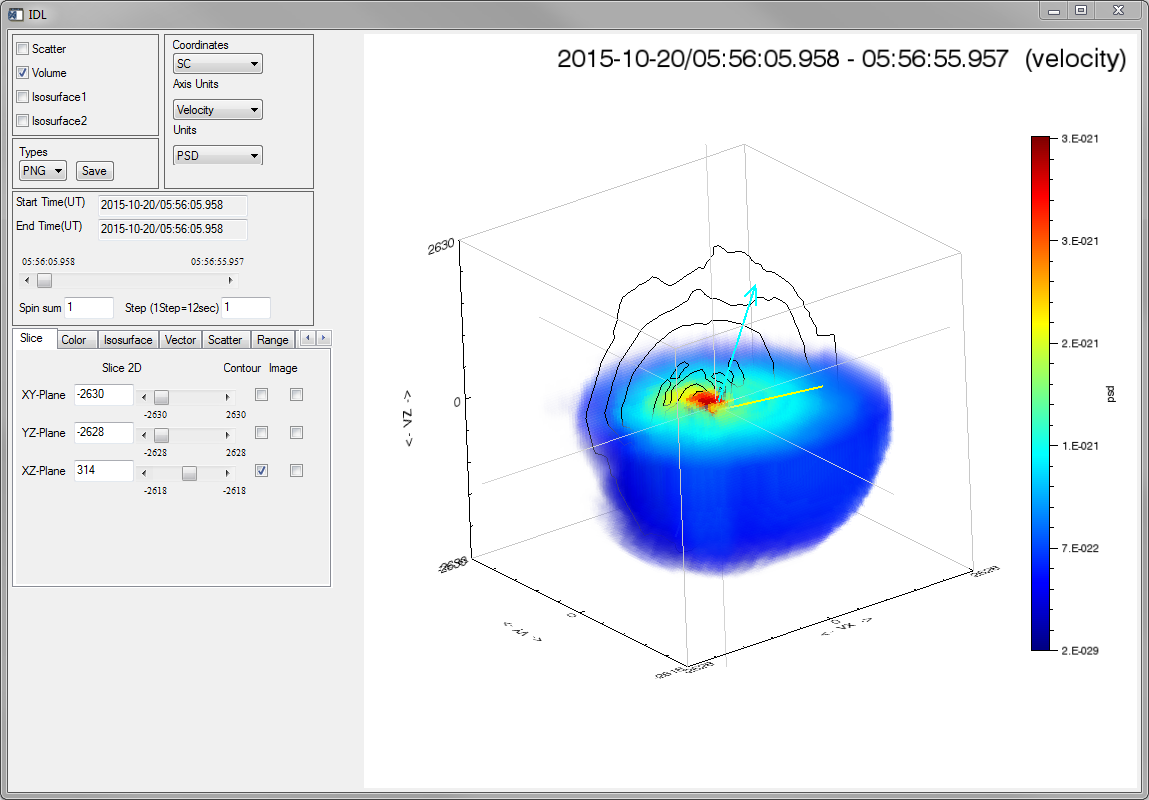
| 23:21, 27 May 2016 | Hpca isee 3d.PNG (file) |  |
204 KB | Floresaa | Visualization of 1 spin of HPCA H+ distribution using ISEE_3D. Image shows screenshot of GUI displaying voxel plot for V_z < 0 km/s (DBCS) and a line contour at y=314 km/s. ISEE_3D was developed by the Institute for Space-Earth Environmental Research... | 1 |
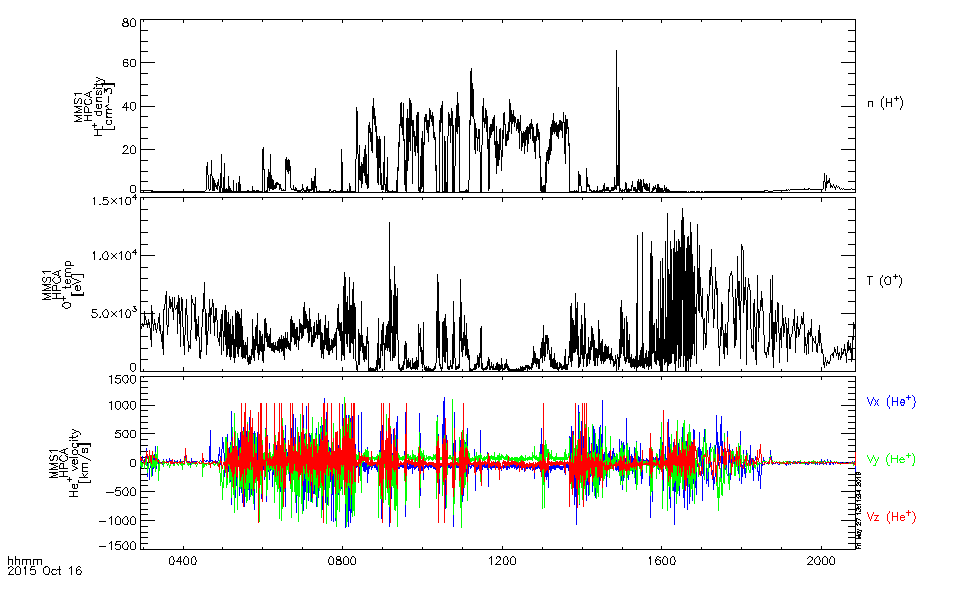
| 22:55, 27 May 2016 | Hpca moments.png (file) |  |
20 KB | Floresaa | Example of ion moments available from mms_load_hpca. Displayed: H+ density, O+ temperature, and He+ velocity. | 1 |
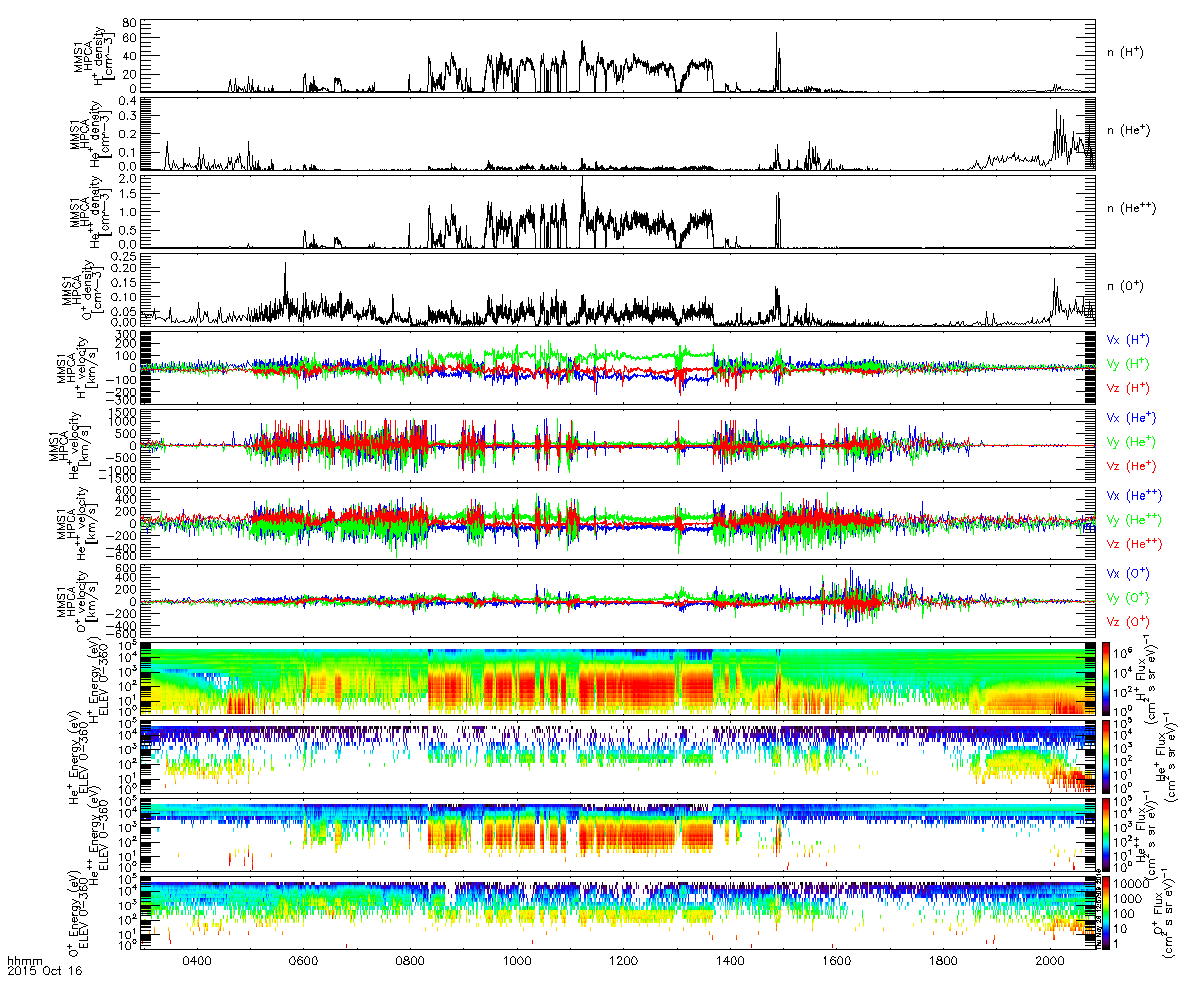
| 22:54, 27 May 2016 | Hpca overview.png (file) |  |
243 KB | Floresaa | Overview of HPCA moments and spectra available from mms_load_hpca. | 1 |
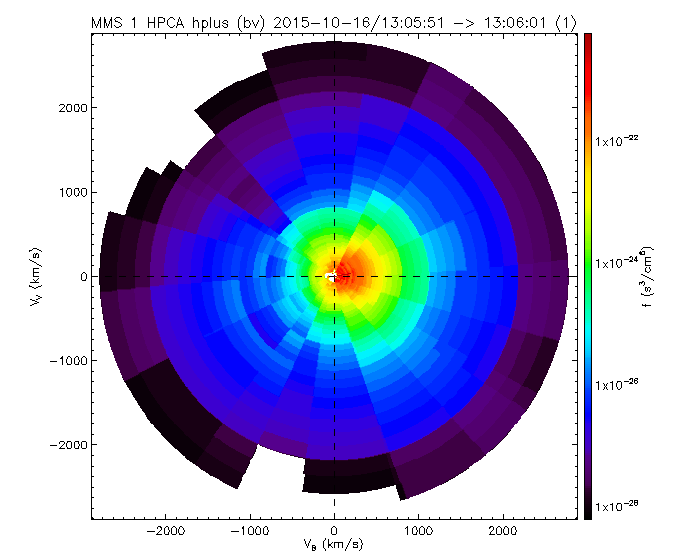
| 23:10, 27 May 2016 | Hpca slice bins.png (file) |  |
35 KB | Floresaa | 2D slice of HPCA H+ distribution for 1 spin showing energy and angle bins. The x axis is parallel to the magnetic field and the y axis is defined by the bulk velocity (V_bulk is within the plane). | 1 |