Uploads by Floresaa
Jump to navigation
Jump to search
This special page shows all uploaded files.
| Date | Name | Thumbnail | Size | Description | Versions |
|---|---|---|---|---|---|
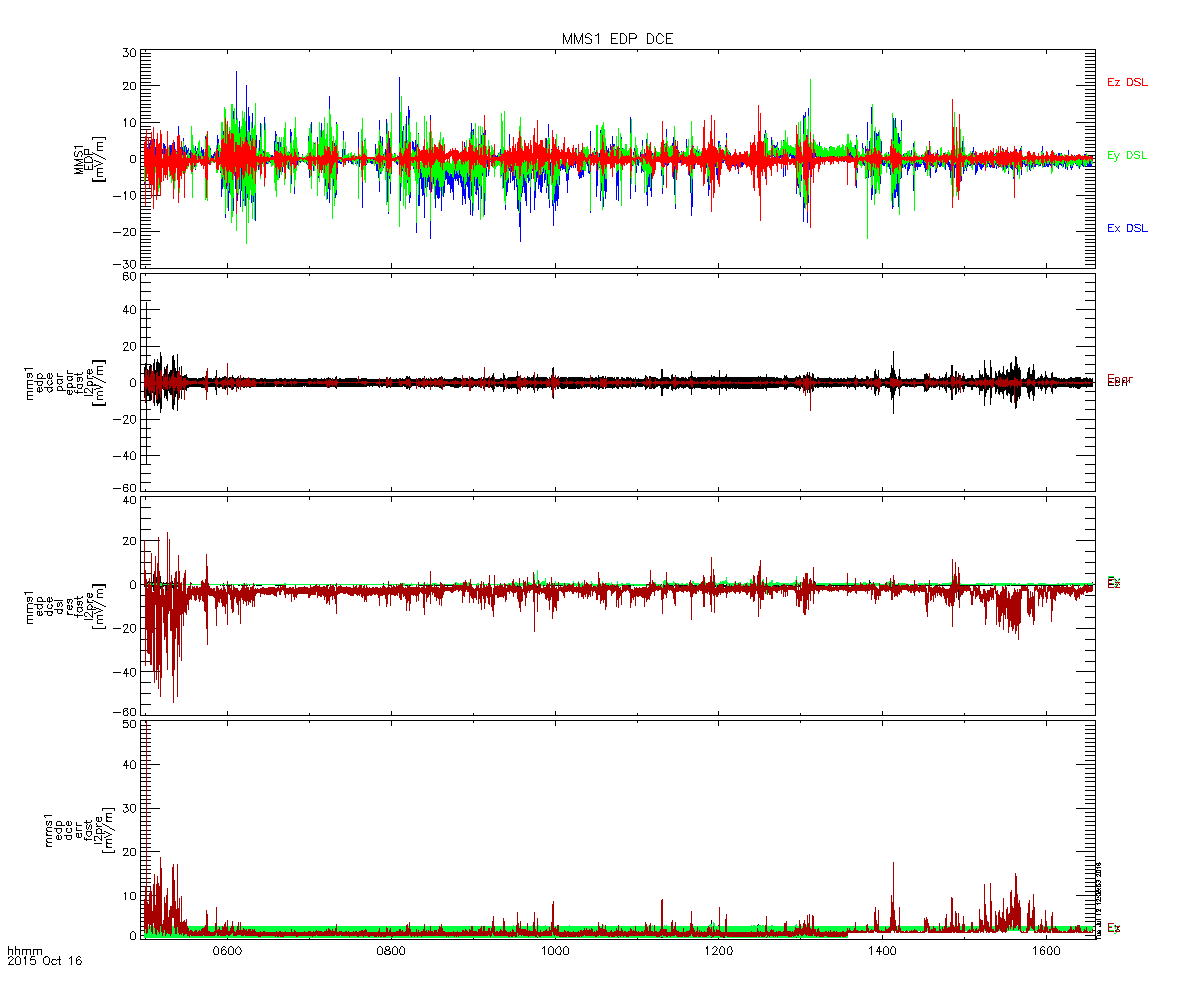
| 19:24, 12 July 2016 | MMS EDP DCE.png (file) |  |
32 KB | MMS1 EDP l2 DCE data. | 1 |
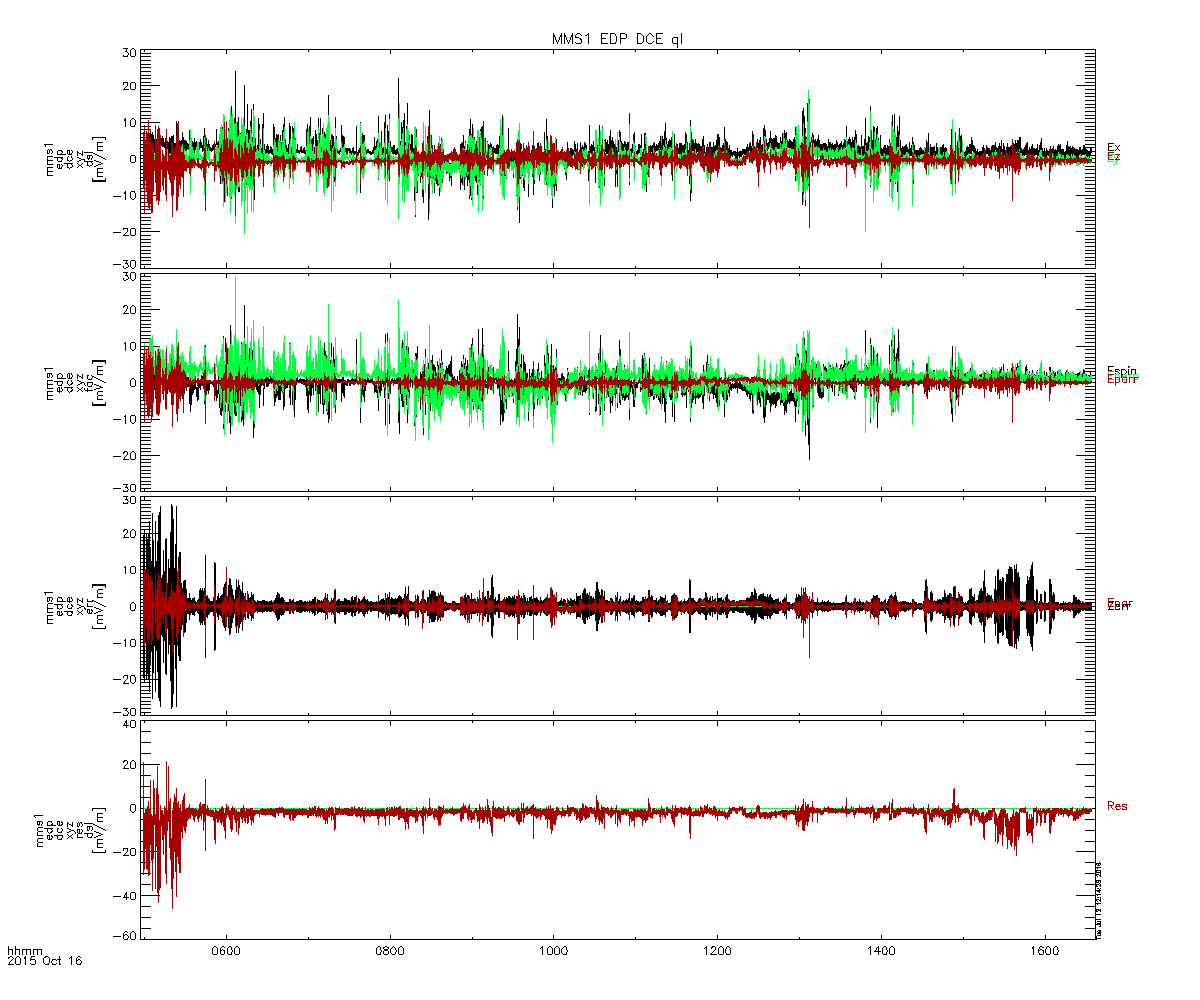
| 19:22, 12 July 2016 | MMS EDP quicklook.png (file) |  |
39 KB | MMS1 EDP quicklook DCE data. | 1 |
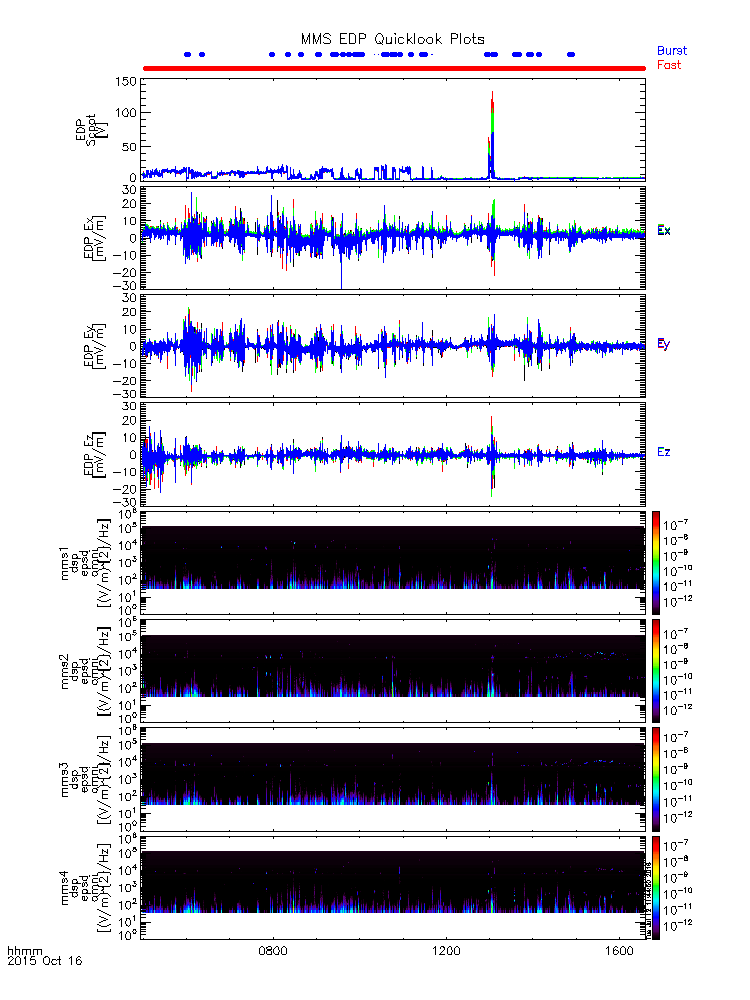
| 19:20, 12 July 2016 | MMS EDP fields quicklook.png (file) |  |
61 KB | MMS EDP quicklook plots from the fields quicklook crib sheet. | 1 |
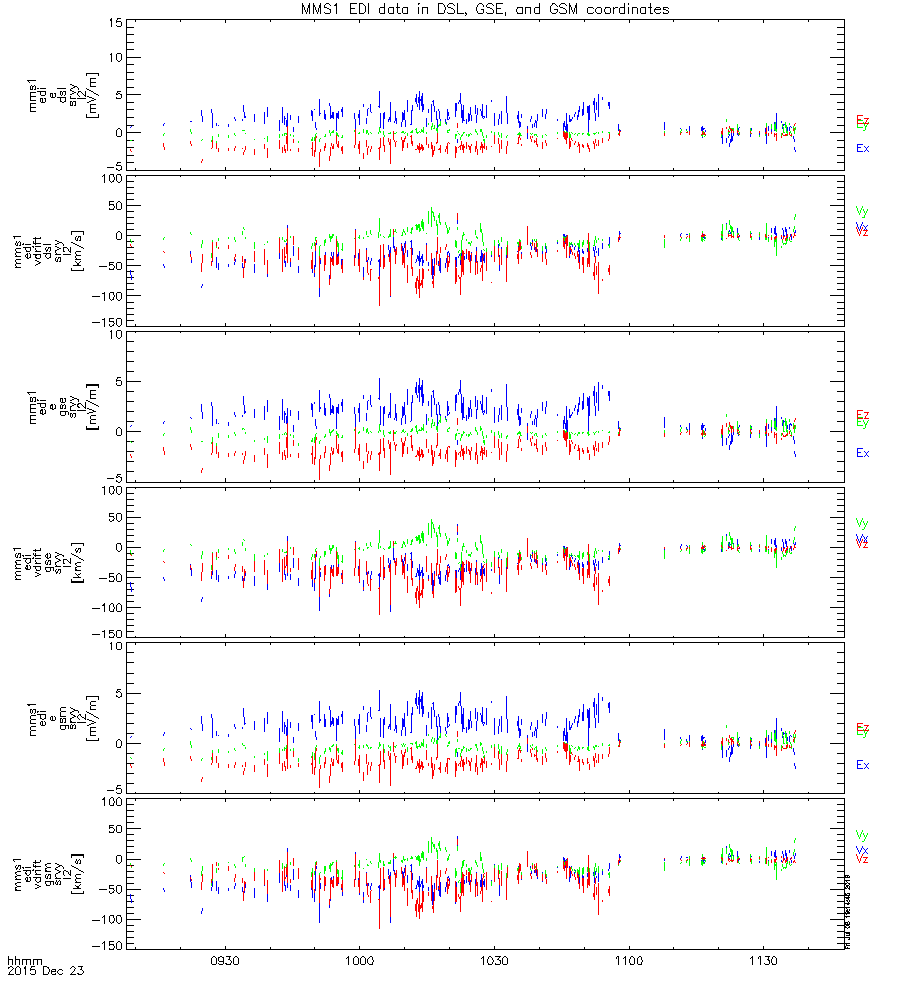
| 02:15, 9 July 2016 | EDI overview.png (file) |  |
32 KB | MMS1 l2 EDI data in DSL, GSE, and GSM coordinates. | 1 |
| 02:05, 9 July 2016 | EDI l2.png (file) |  |
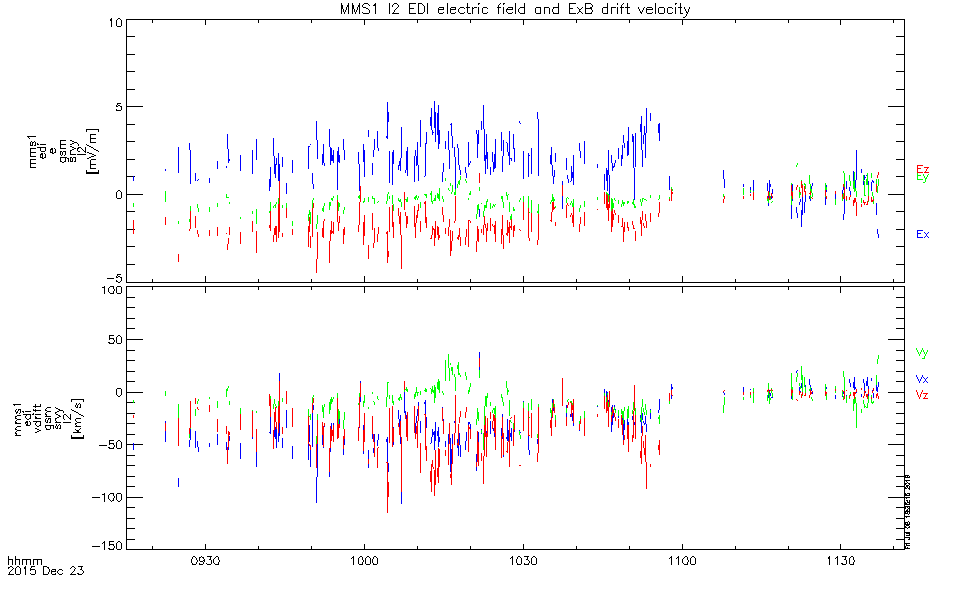
14 KB | MMS1 l2 EDI electric field and ExB drift velocity. | 1 |
| 02:02, 9 July 2016 | EDI ql.png (file) |  |
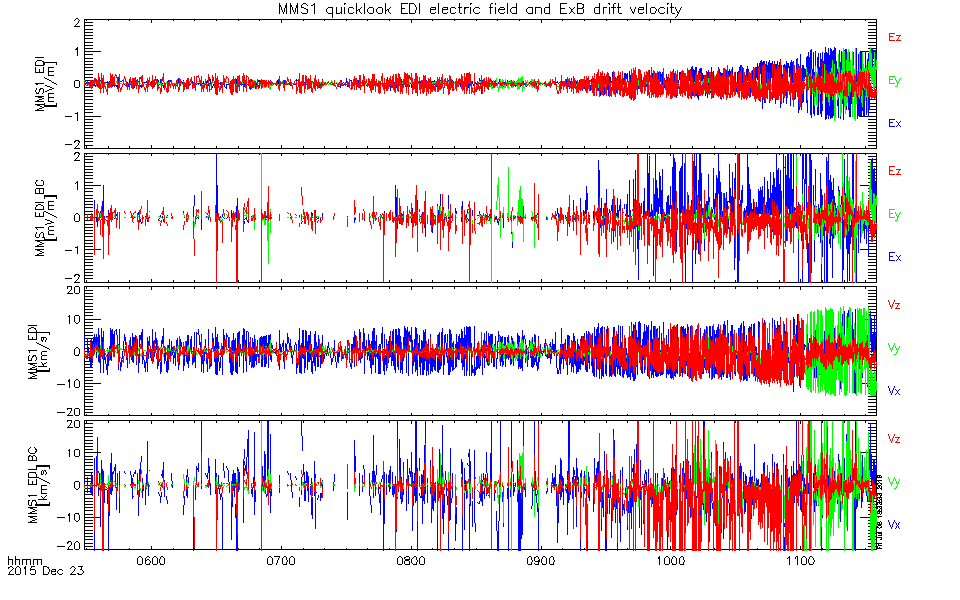
33 KB | MMS1 quicklook EDI electric field and ExB drift velocity - "bestarg" and "beam convergence" methods. | 1 |
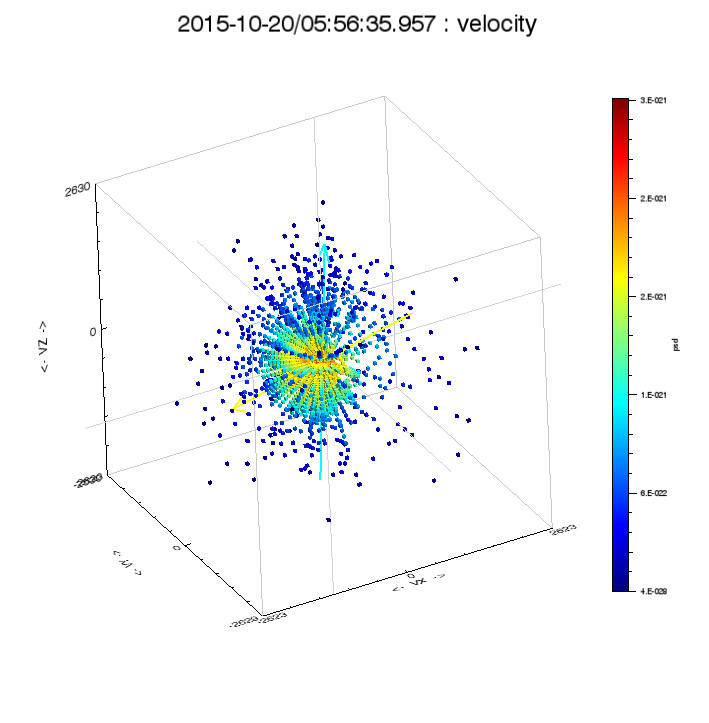
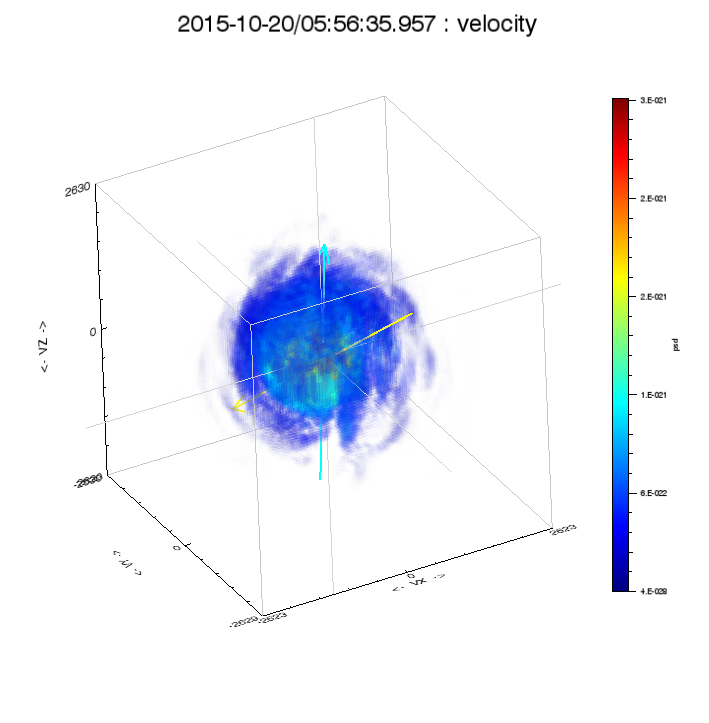
| 23:21, 27 May 2016 | Hpca isee 3d.PNG (file) |  |
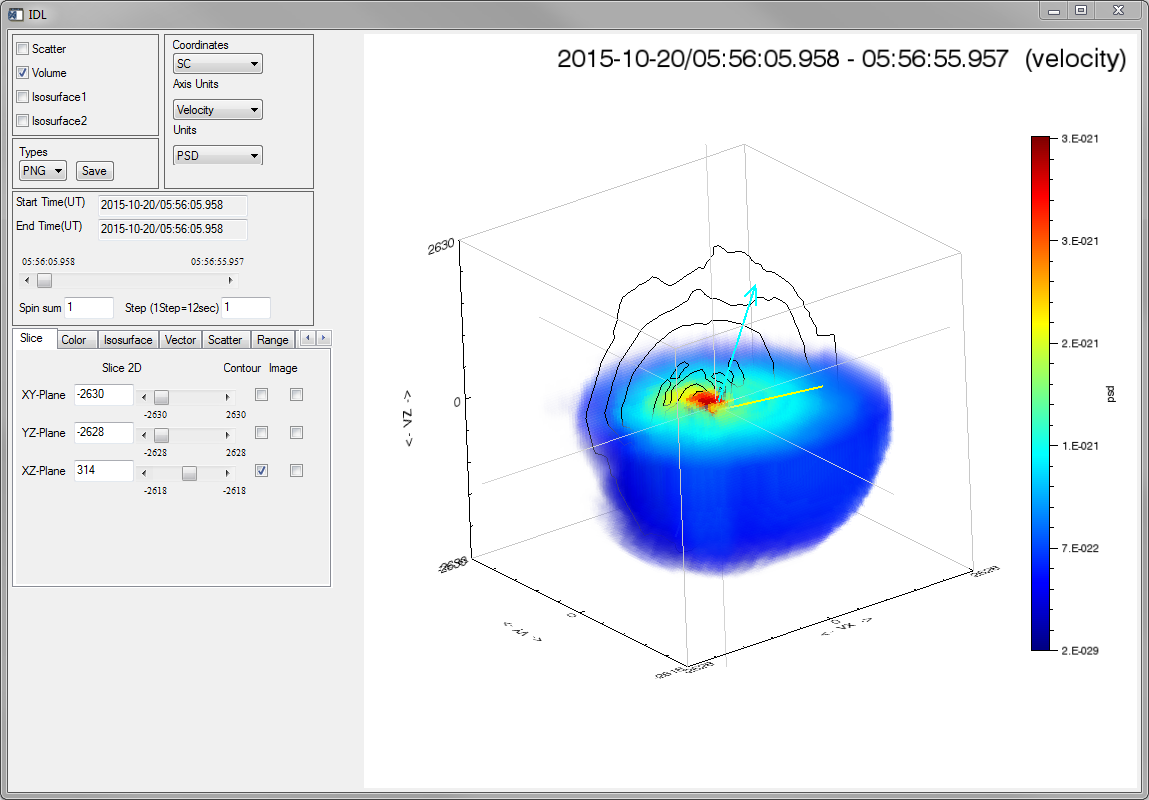
204 KB | Visualization of 1 spin of HPCA H+ distribution using ISEE_3D. Image shows screenshot of GUI displaying voxel plot for V_z < 0 km/s (DBCS) and a line contour at y=314 km/s. ISEE_3D was developed by the Institute for Space-Earth Environmental Research... | 1 |
| 23:10, 27 May 2016 | Hpca slice bins.png (file) |  |
35 KB | 2D slice of HPCA H+ distribution for 1 spin showing energy and angle bins. The x axis is parallel to the magnetic field and the y axis is defined by the bulk velocity (V_bulk is within the plane). | 1 |
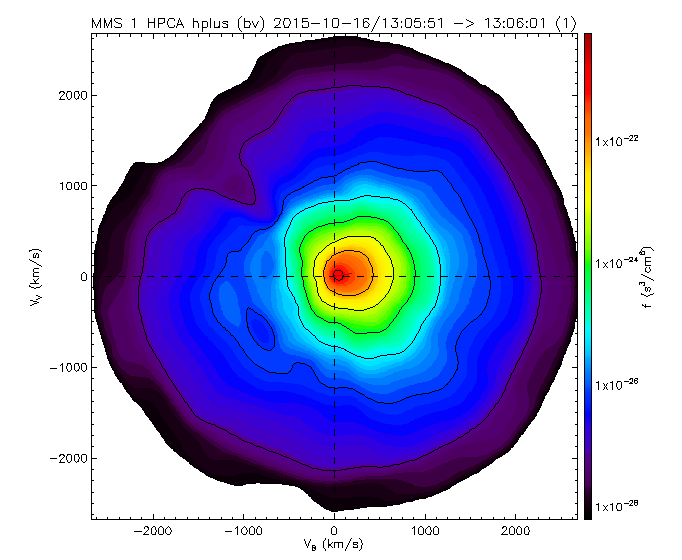
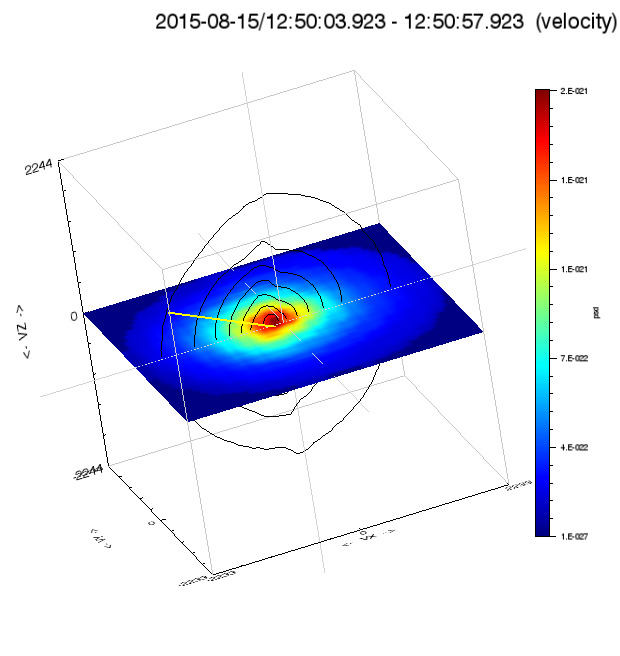
| 23:08, 27 May 2016 | Hpca slice contour.png (file) |  |
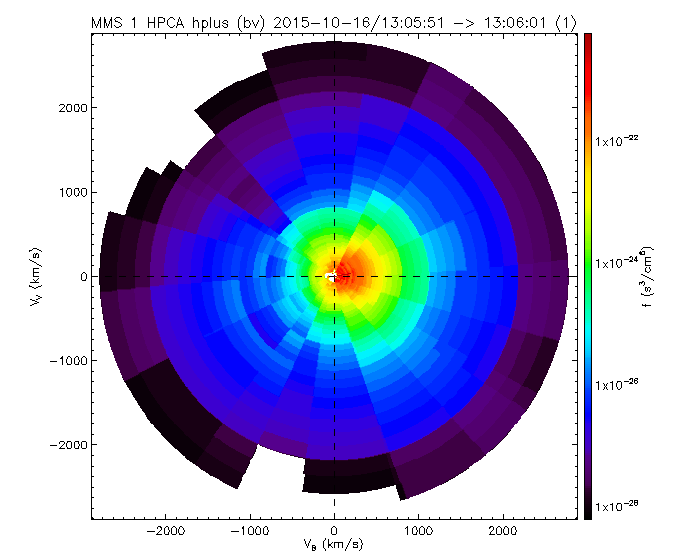
36 KB | Contoured 2D slice of HPCA H+ distribution for 1 spin. The x axis is parallel to the magnetic field and the y axis is defined by the bulk velocity (V_bulk is within the plane). | 1 |
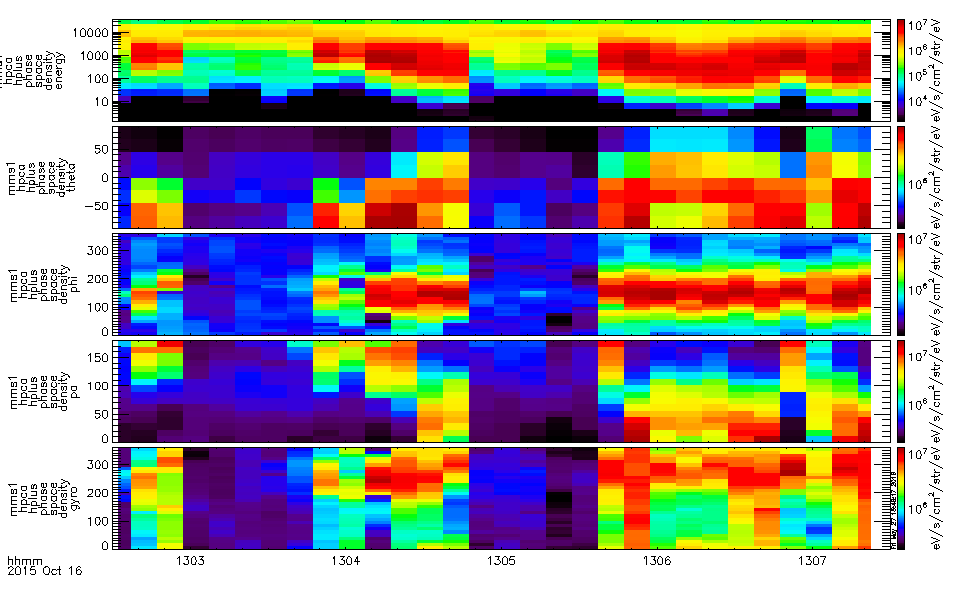
| 23:02, 27 May 2016 | Hpca spd spec.png (file) |  |
31 KB | Example of spectrograms calculated from 3D HPCA H+ distributions. Displayed: H+ energy, phi (sc-azimuth), theta (sc-elevation), pitch angle (mag-co-lat), and gyrophase (mag-azimuth). | 1 |
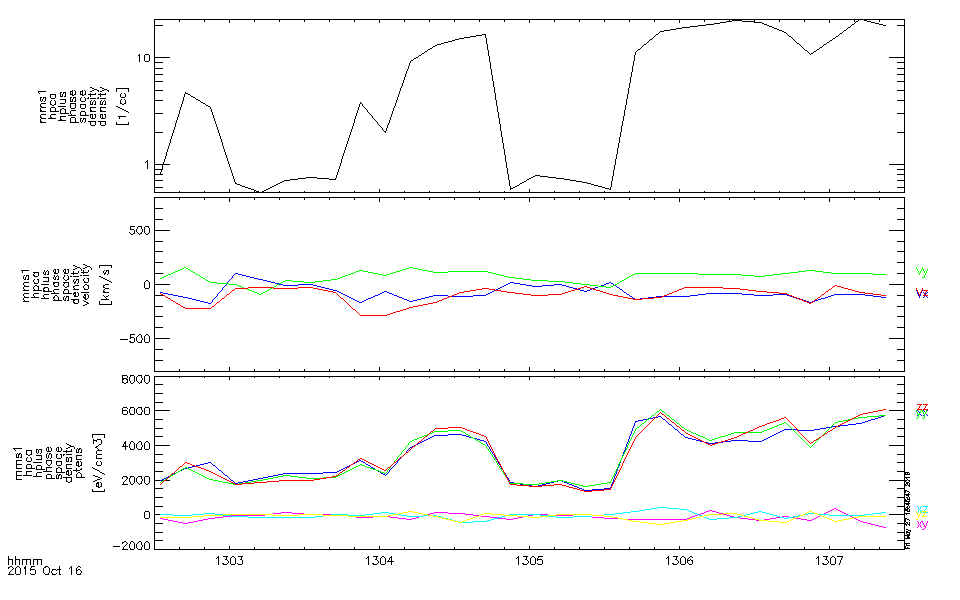
| 22:59, 27 May 2016 | Hpca spd moments.png (file) |  |
15 KB | Example of moments calculated from 3D HPCA H+ distributions. Displayed: H+ density, velocity, and pressure tensor. | 1 |
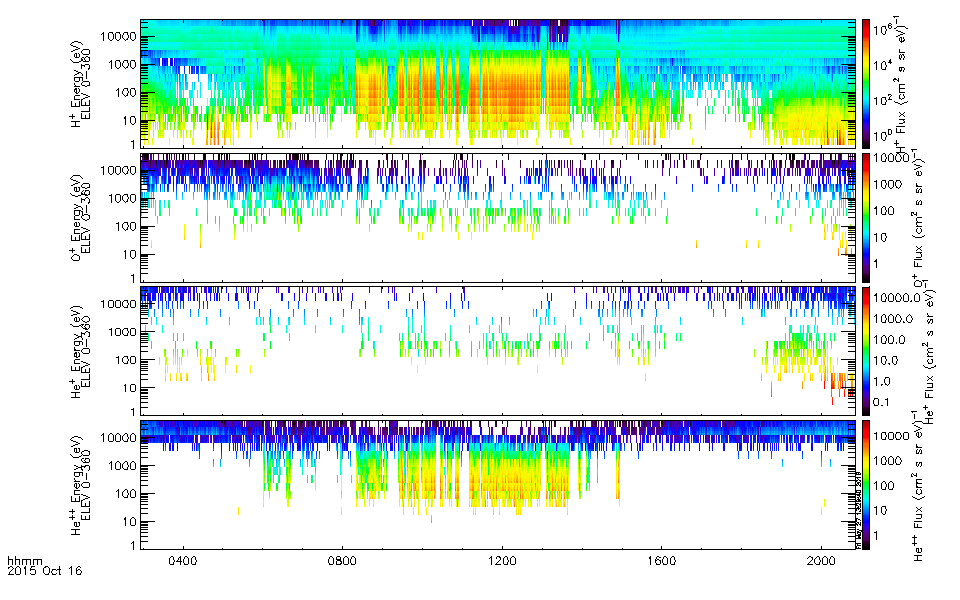
| 22:57, 27 May 2016 | Hpca espec.png (file) |  |
120 KB | Example of HPCA ion energy spectra available from mms_load_hpca. Displayed: H+, O+, He+, and He++ energy spectrograms. | 1 |
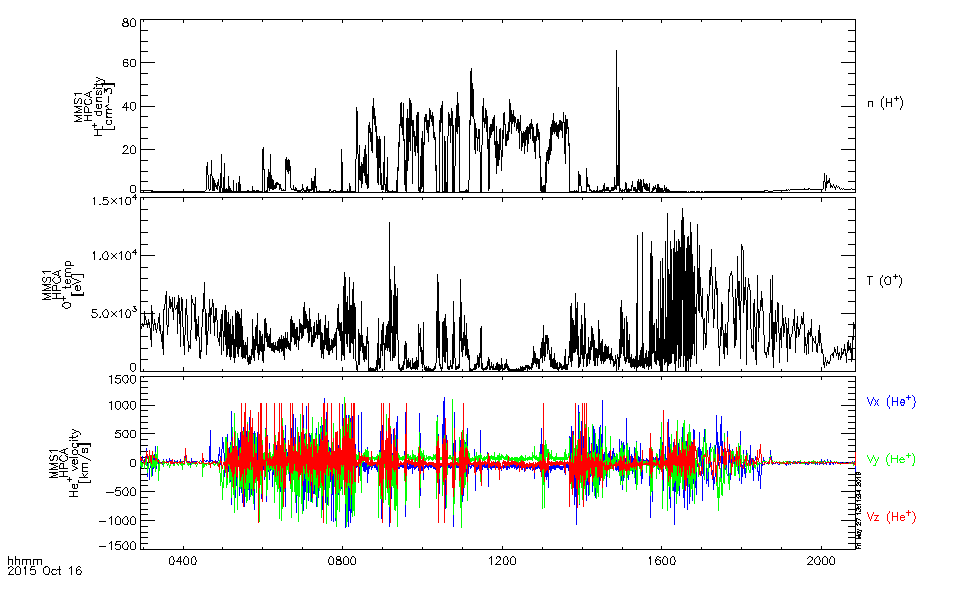
| 22:55, 27 May 2016 | Hpca moments.png (file) |  |
20 KB | Example of ion moments available from mms_load_hpca. Displayed: H+ density, O+ temperature, and He+ velocity. | 1 |
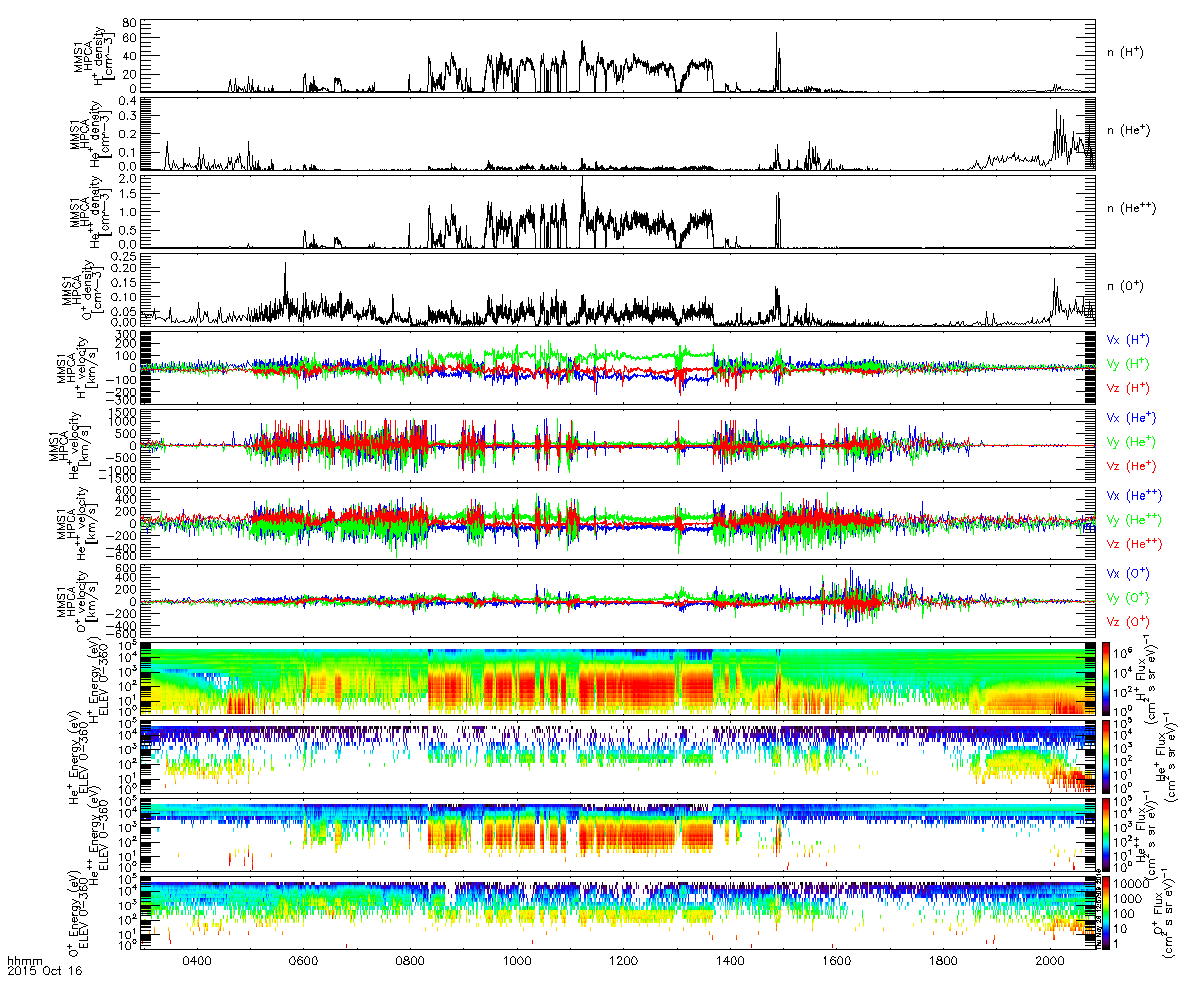
| 22:54, 27 May 2016 | Hpca overview.png (file) |  |
243 KB | Overview of HPCA moments and spectra available from mms_load_hpca. | 1 |
| 00:07, 12 March 2016 | Mms fpi contour.png (file) |  |
62 KB | Two-dimensional slice of single three-dimensional MMS FPI ion distribution. Color contours are drawn along the x-y plane with contour lines drawn on x-z. | 1 |
| 00:04, 12 March 2016 | Mms fpi scatter.png (file) |  |
59 KB | Single three-dimensional MMS FPI ion distribution with orignal (non-interpolated) data points plotted. | 1 |
| 00:02, 12 March 2016 | Mms fpi volume.png (file) |  |
101 KB | Single three-dimensional MMS FPI ion distribution plotted as volume in phase space. | 1 |
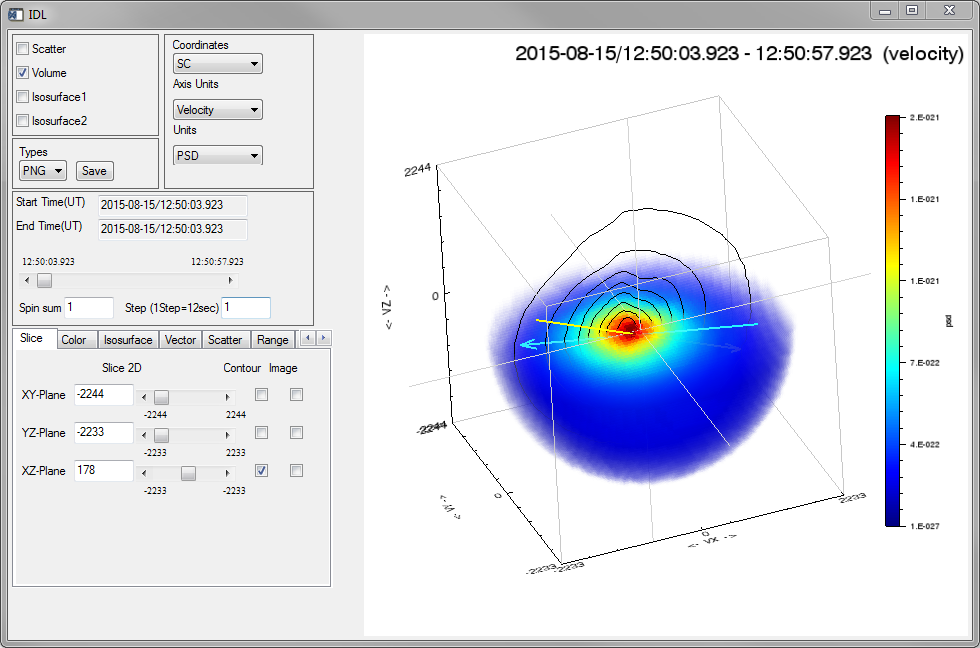
| 00:00, 12 March 2016 | Stel3d mms fpi ion vol contours.PNG (file) |  |
167 KB | STEL3D tool displaying MMS FPI ion data. The plotted volume is data with V_z < 0. Contour lines are drawn along the x-z plane. | 1 |
| 00:35, 27 February 2016 | MMS Dayside Overview.png (file) |  |
181 KB | Basic dayside science overview plot created with mms_basic_dayside crib sheet. | 1 |
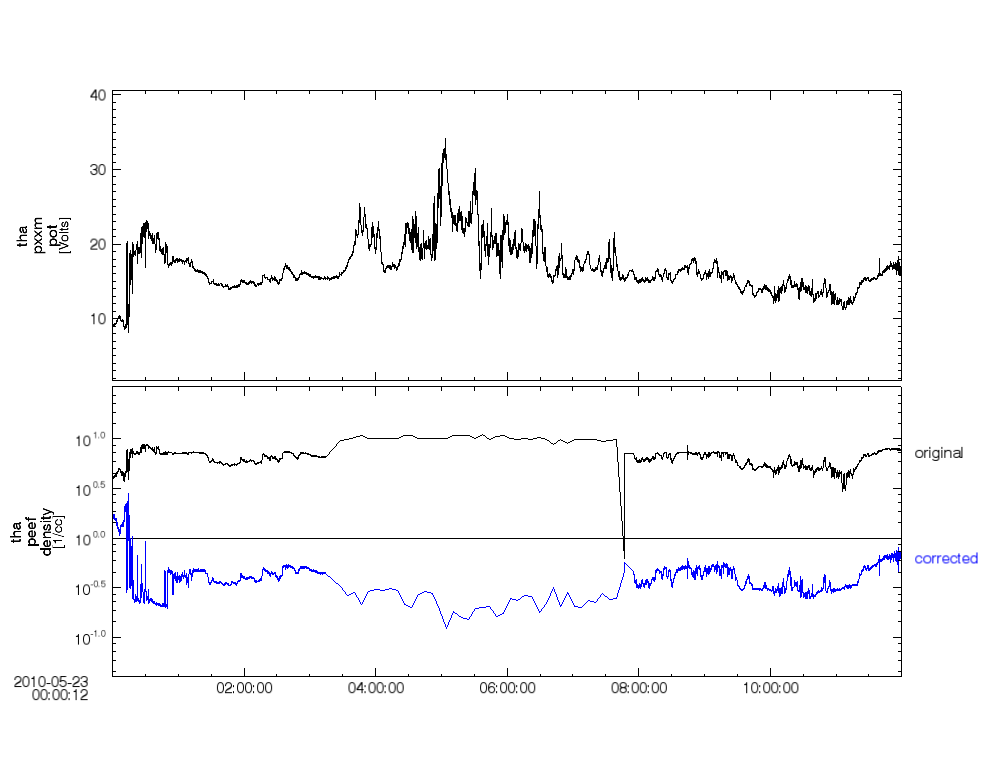
| 21:48, 21 May 2015 | Pot dens compare.png (file) |  |
38 KB | Spacecraft potential with corrected and uncorrected density data. | 1 |
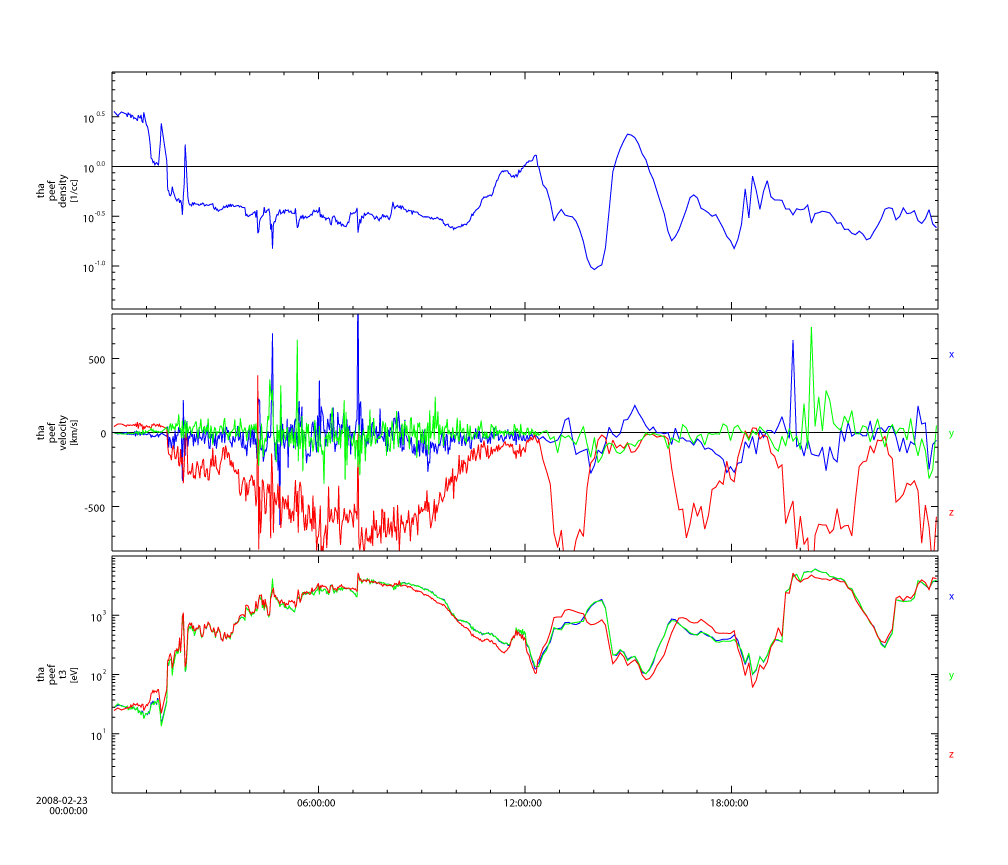
| 18:51, 4 September 2014 | Peef moments example.png (file) |  |
88 KB | Example plot of THEMIS ESA electron moments. | 1 |
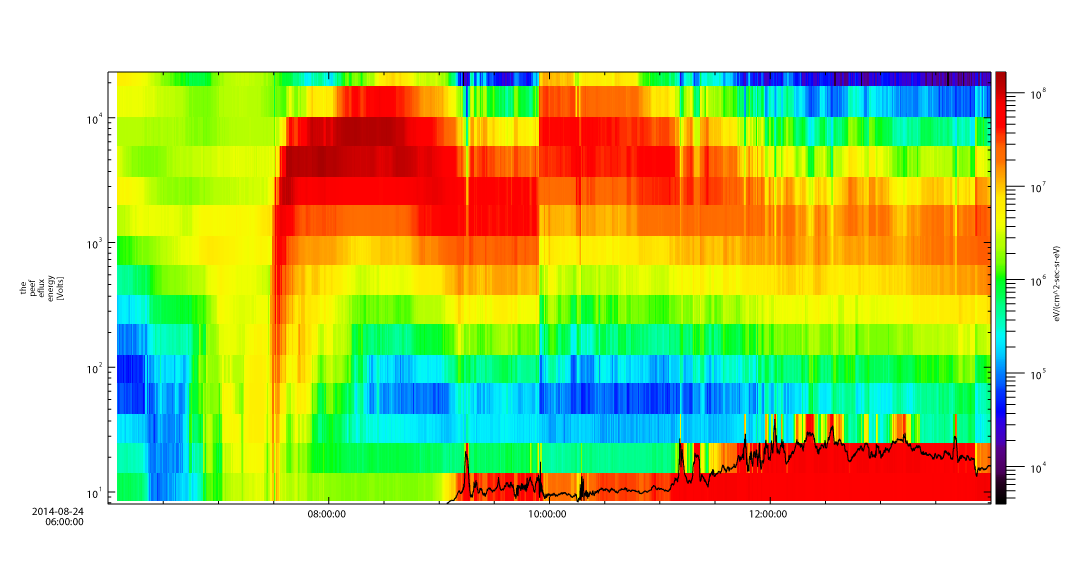
| 00:24, 30 August 2014 | Espec pot.png (file) |  |
50 KB | Energy spectrogram of ESA electron data with overlaid spacecraft potential. | 1 |
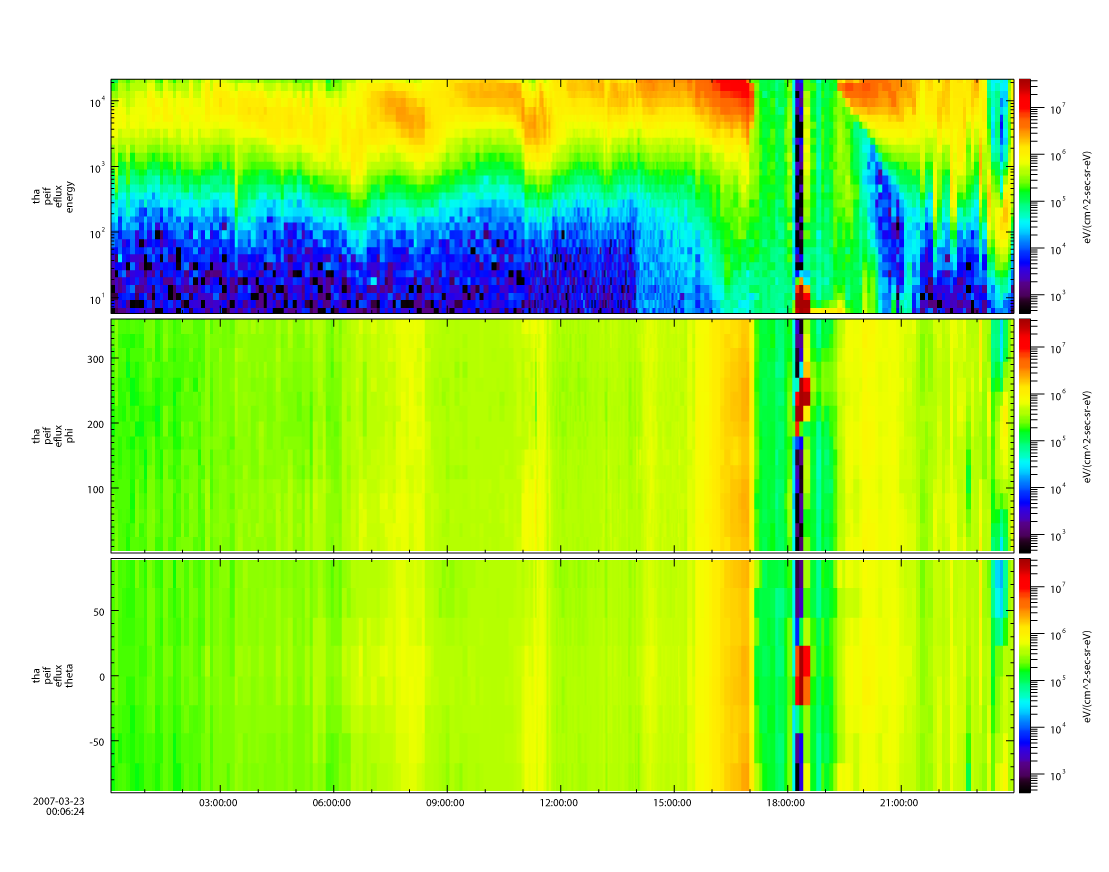
| 01:18, 22 August 2014 | Thm esa spec.png (file) |  |
117 KB | Energy, phi, and theta spectrograms for ESA ion data. | 1 |
| 21:42, 20 August 2014 | Themis slice2d geo bv example.png (file) |  |
71 KB | Basic example of a THEMIS particle distribution slice using the geometric method for ESA ion burst data. The x axis is parallel to the magnetic field, the y axis is defined such that the slice plane contains the bulk velocity vector (red). | 1 |
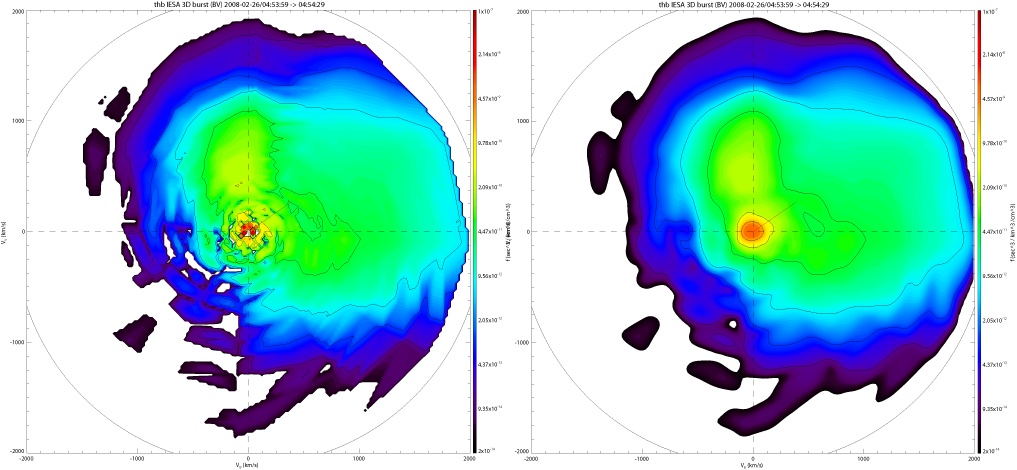
| 21:31, 20 August 2014 | Thm slice smooth.png (file) |  |
313 KB | Distribution slice of ESA ion burst data using 3D interpolation. Left plot has no smoothing, right plot has default 7 pt smoothing window applied (both use default 150pt plot resolution). | 1 |
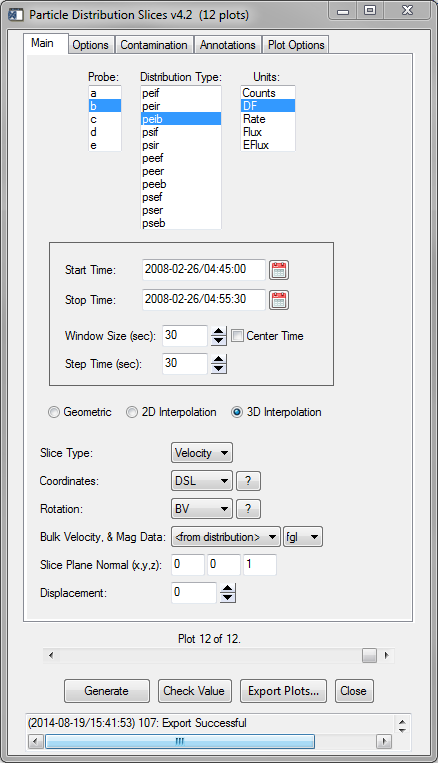
| 23:38, 19 August 2014 | Thm slice2d gui.PNG (file) |  |
39 KB | Graphical interface for generating and plotting particle distribution slices. | 1 |
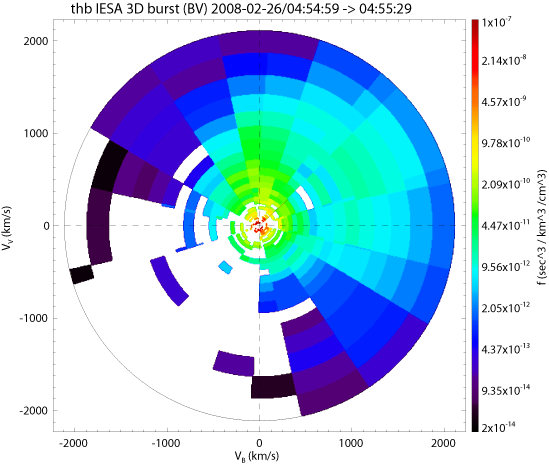
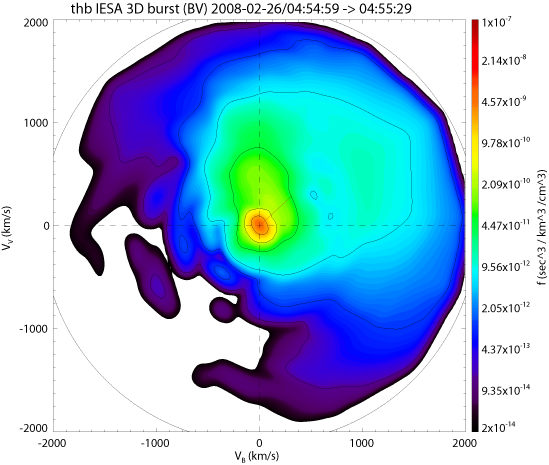
| 23:17, 19 August 2014 | Themis slice2d 3d bv example.png (file) |  |
134 KB | Basic example of a THEMIS particle distribution slice using ESA ion burst data. The x axis is parallel to the magnetic field, the y axis is defined such that the slice plane contains the bulk velocity vector (red). | 1 |
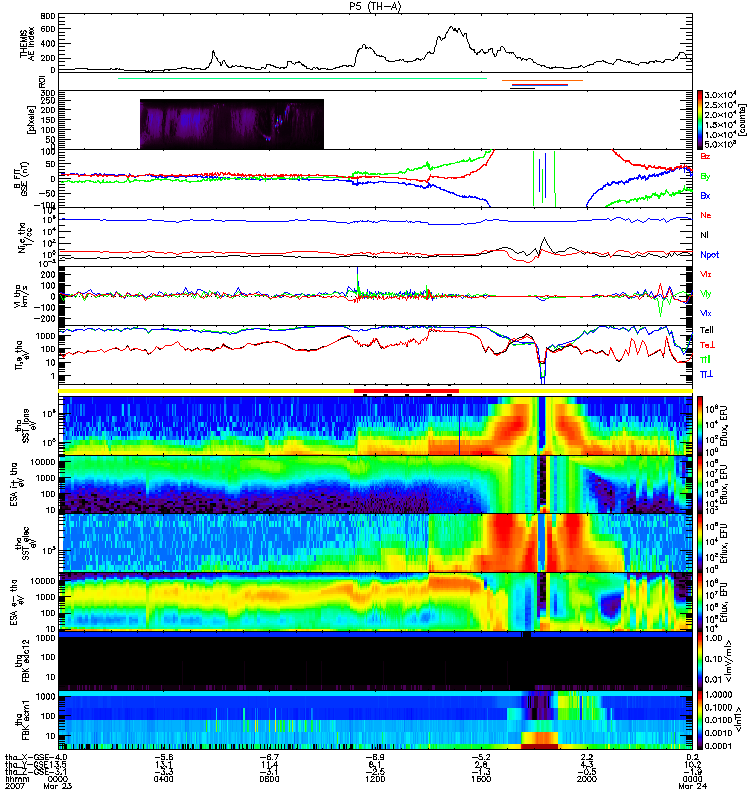
| 23:11, 1 April 2014 | Tha l2 overview 20070323 0024.png (file) |  |
61 KB | Single-day summary plot for THEMIS probe A on 2007-03-23. | 1 |