THEMIS Particle Spectrograms

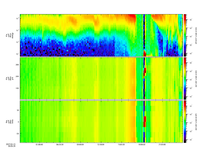
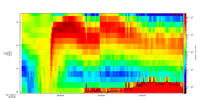
Angular and energy spectrograms can be produced from THEMIS ESA and SST particle data. Spectrograms (or spectra) are produced after selecting a spacecraft, data type, and time range. The data are then averaged across the non-selected dimensions and plotted across time. Magnetic field aligned spectra can also be generated.
For command line usage see:
SPEDAS Plugin

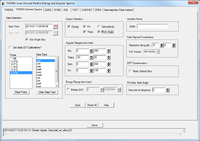
Particle spectrograms can be created from the SPEDAS GUI.
From the File menu select Load Data then select the THEMIS Derived Spectra tab. Most parameters can be edited from this interface, however some remain command line only. Multiple probes and data types may be selected. All selected output types will be created for each probe/datatype combination. Required support data will be loaded automatically.
Basic Spectrograms
These spectra are created by averaging the data in the native DSL coordinates.
All basic spectra are produced by default when using the command line. Outputs may also be specified:
Energy
The data are averaged across all look directions (phi & theta) to create an omni-directional energy spectrogram. The plot's y axis is energy.
Phi
The data are averaged across energy and theta (latitude - measured from the spacecraft's spin plane to spin axis) to create an azimuthal spectrogram. The plot's y axis is phi (longitude).
Theta
The data are average across energy and phi (longitude - measured along the spacecraft's spin plane) to create a latitudinal spectrogram. The plot's y axis is theta (latitude).
Field Aligned Spectrograms
Field aligned spectra are produced by first transforming the data into magnetic field aligned coordinates. Field aligned coordinates always use the magnetic field as their z axis. The direction of x and y depend on the particular variant. By default, th?_fgs will be used as the magnetic field vector, however any tplot variable may be used. After the data is transformed into the new coordinates it is interpolated onto a regular grid. The resolution of that grid may be specified. For information on magnetic field variables see THEMIS Fluxgate Magnetometer.
Gyrophase
The data are transformed into magnetic field aligned coordinates then averaged across all energies and latitudes to create a field aligned azimuthal spectrogram. The plot's y axis is gyrophase (latitude) starting from the coordinate's x axis.
Pitch Angle
The data are transformed into magnetic field aligned coordinates then averaged across all energies and longitudes to create a field aligned colatitudinal spectrogram. This plot's y axis is pitch angle (colatitude) from the magnetic field (z axis)
Energy and angle limits
The subset of the data used to produce spectra can be constrained by setting limits to energy, phi, theta, gyrophase, and pitch angle. Data outside the specified limits will be ignored when producing spectra. Limits to energy, phi, and theta apply to all outputs. Limits to gyrophase and pitch angle ranges will only apple to field aligned spectra and energy spectra. Phi and gyrophase limits are allowed to span 0°.
Contamination
Spacecraft potential

Increased spacecraft potential may affect the lower energy bins for ESA data. A tplot variable containing spacecraft potential can be specified when producing spectra (and moments). If no variable is specified then "th?_pxxm_pot" will be used, if present. Spacecraft potential must be loaded separately:
ESA background subtraction
Background subtraction for ESA data is enabled by default when producing spectra. For background removal options see ESA Background Removal. For example usage see:
SST contamination
In most cases, contaminated SST bins should be masked and interpolated over automatically. If the default set of bins is inadequate then a list may be specified instead. For more information see SST Contamination Removal.