View Menu - SPEDAS GUI

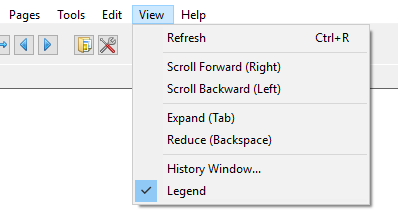
The View menu contains items that modify the look of the main GUI window and/or the page and panels displayed in the main graph area.
Refresh
You can use the Refresh option in the View pull down menu at any time to redraw the ‘active’ page. The Refresh option also has an accelerator key, Ctrl-R.
Scroll Forward/Backward
Scrolling can be invoked in three ways, using the Scroll Forward or Scroll Backward option in the View pull down menu, using the left and right arrow keys, or by using the scroll icons in the toolbar. A scroll request will move the x-axis forward or backward by the range of a major tick. This operation will be done for all panels in the active page.
Expand/Reduce
Similar to scrolling the Scrolling forward can be invoked in three ways, using the Scroll Forward or Scroll Backward option in the View pull down menu, using the ctrl and tab keys, or by using the expand/reduce icons in the toolbar. A expand/reduce request will expand/contract the x-axis of the displayed data by a major tick.
History Window

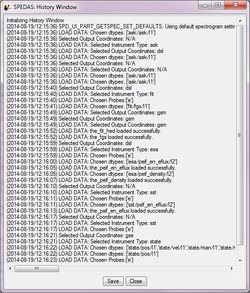
The history window is a list of the steps, operations, and plots that have been executed during the course of your session, as well as warning and error messages. Just below the history window are buttons that allow the user to save the history in a file, and clear the history. The "Save" button will save the history in an IDL source file. When you click here, a file selection window pops up, allowing you to choose the filename and path for the file. The default file is "thm_gui_history_yyyymmddss.pro" and is located in your local working directory. The time stamp on the default file name is the local system time. The "Close" button close the history window. History window messages are not lost when the window is closed. History messages are recorded at all times while the SPEDAS GUI is running, regardless of whether the window is displayed or not.
Since the history information includes error message, it will be used as a debugging tool. When an unexpected error is encountered during your session, you will be notified with a message and the Error Report Form will be displayed. When the Save button is clicked in the Error Report window both the Error Report Form and the History file are saved. When the Save button is clicked in the History window only the history file is saved. In addition to history messages, IDL journal messages will also be appended to the file.
Legend
The legend displays a value for each variable within the panel. The value displayed is the value at the point where the vertical tracking line intersects the data line, in other words the x value of the data at the x position of the cursor. Whenever the cursor is moved the values in the legend will be updated. Note that along with the y-axis labels, the legend labels and values are color-coded and synchronized with the color of the line within the plot.
Legend formatting, placement, and annotation options can be changed in the Legend Options window accessible through the Graph menu at the top of the GUI. The legend can be turned off by un-checking the Legend option in the View pull down menu. The legend and tracking bars will not appear on any exported plots (images, postscript, physical prints).