ISEE 3D: Difference between revisions
m (lower case pathname for linux/os x users) |
(updating location/name of the crib sheet) |
||
| Line 7: | Line 7: | ||
/projects/themis/examples/advanced/thm_crib_stel3d.pro | /projects/themis/examples/advanced/thm_crib_stel3d.pro | ||
/projects/mms/examples/ | /projects/mms/examples/advanced/mms_isee_3d_crib.pro | ||
</div> | </div> | ||
Revision as of 21:46, 26 May 2016

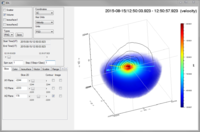
STEL3D Is a graphical interface for three-dimensional plotting of space plasma particle distributions developed by the Solar-Terrestrial Environment Laboratory at Nagoya University. It can currently plot data from the Geotail, MMS, and THEMIS/ARTEMIS missions.
For example usage see:
Overview
STEL3D is run from the IDL command line. It loads a time series of data from ASCII files (Geotail) or IDL variables (MMS & THEMIS/ARTEMIS). A single plot is displayed at one time. Multiple distributions can be summed/averaged to create a single plot and a time series of distributions can be scrolled through with the time slider. Multiple plot types can be drawn simultaneously.
Data may be viewed in phase space density or counts (when available) and plotted against energy or velocity in spacecraft or field/velocity-aligned coordinates.
The orientation of the plot can be changed by clicking & dragging withing the plot window and the zoom can be controlled with the mouse wheel. Other viewing options are found in the View tab.
Plot types
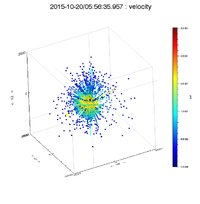
Scatter

The scatter plot option displays the original data points as a three-dimensional scatter plot. The scatter plot color scaling is controlled from the Scatter tab.
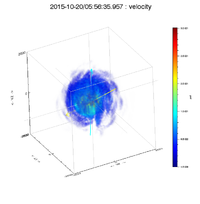
Volume

The volume plot displays interpolated data as a three-dimensional volume. The data are interpolated in three dimensions and displayed as colored voxels. The displayed volume can be limited to a particular range along a given axis in the Range tab. The color scaling is controlled from the Color tab.
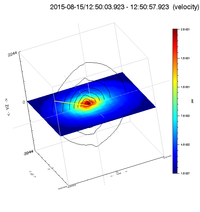
Contour

Contour plots show two-dimensional color and/or line contours from the interpolated data volume. Contours are drawn along primary axis planes (xy, yz, xz). Contours can be added from the Slice tab. The number and placement of contour lines can be specified in the Color tab.
Surface
Surface plots display a surface of constant value from the interpolated data volume. Two surfaces can be drawn simultaneously. Their color and values are controlled from the Isosurface tab.
External Links
- STEL - Solar-Terrestrial Environment Laboratory, Nagoya University
- Geospace Research Center - Geospace Research Center, Nagoya Univesity