File list
Jump to navigation
Jump to search
This special page shows all uploaded files.
| Date | Name | Thumbnail | Size | User | Description | Versions |
|---|---|---|---|---|---|---|
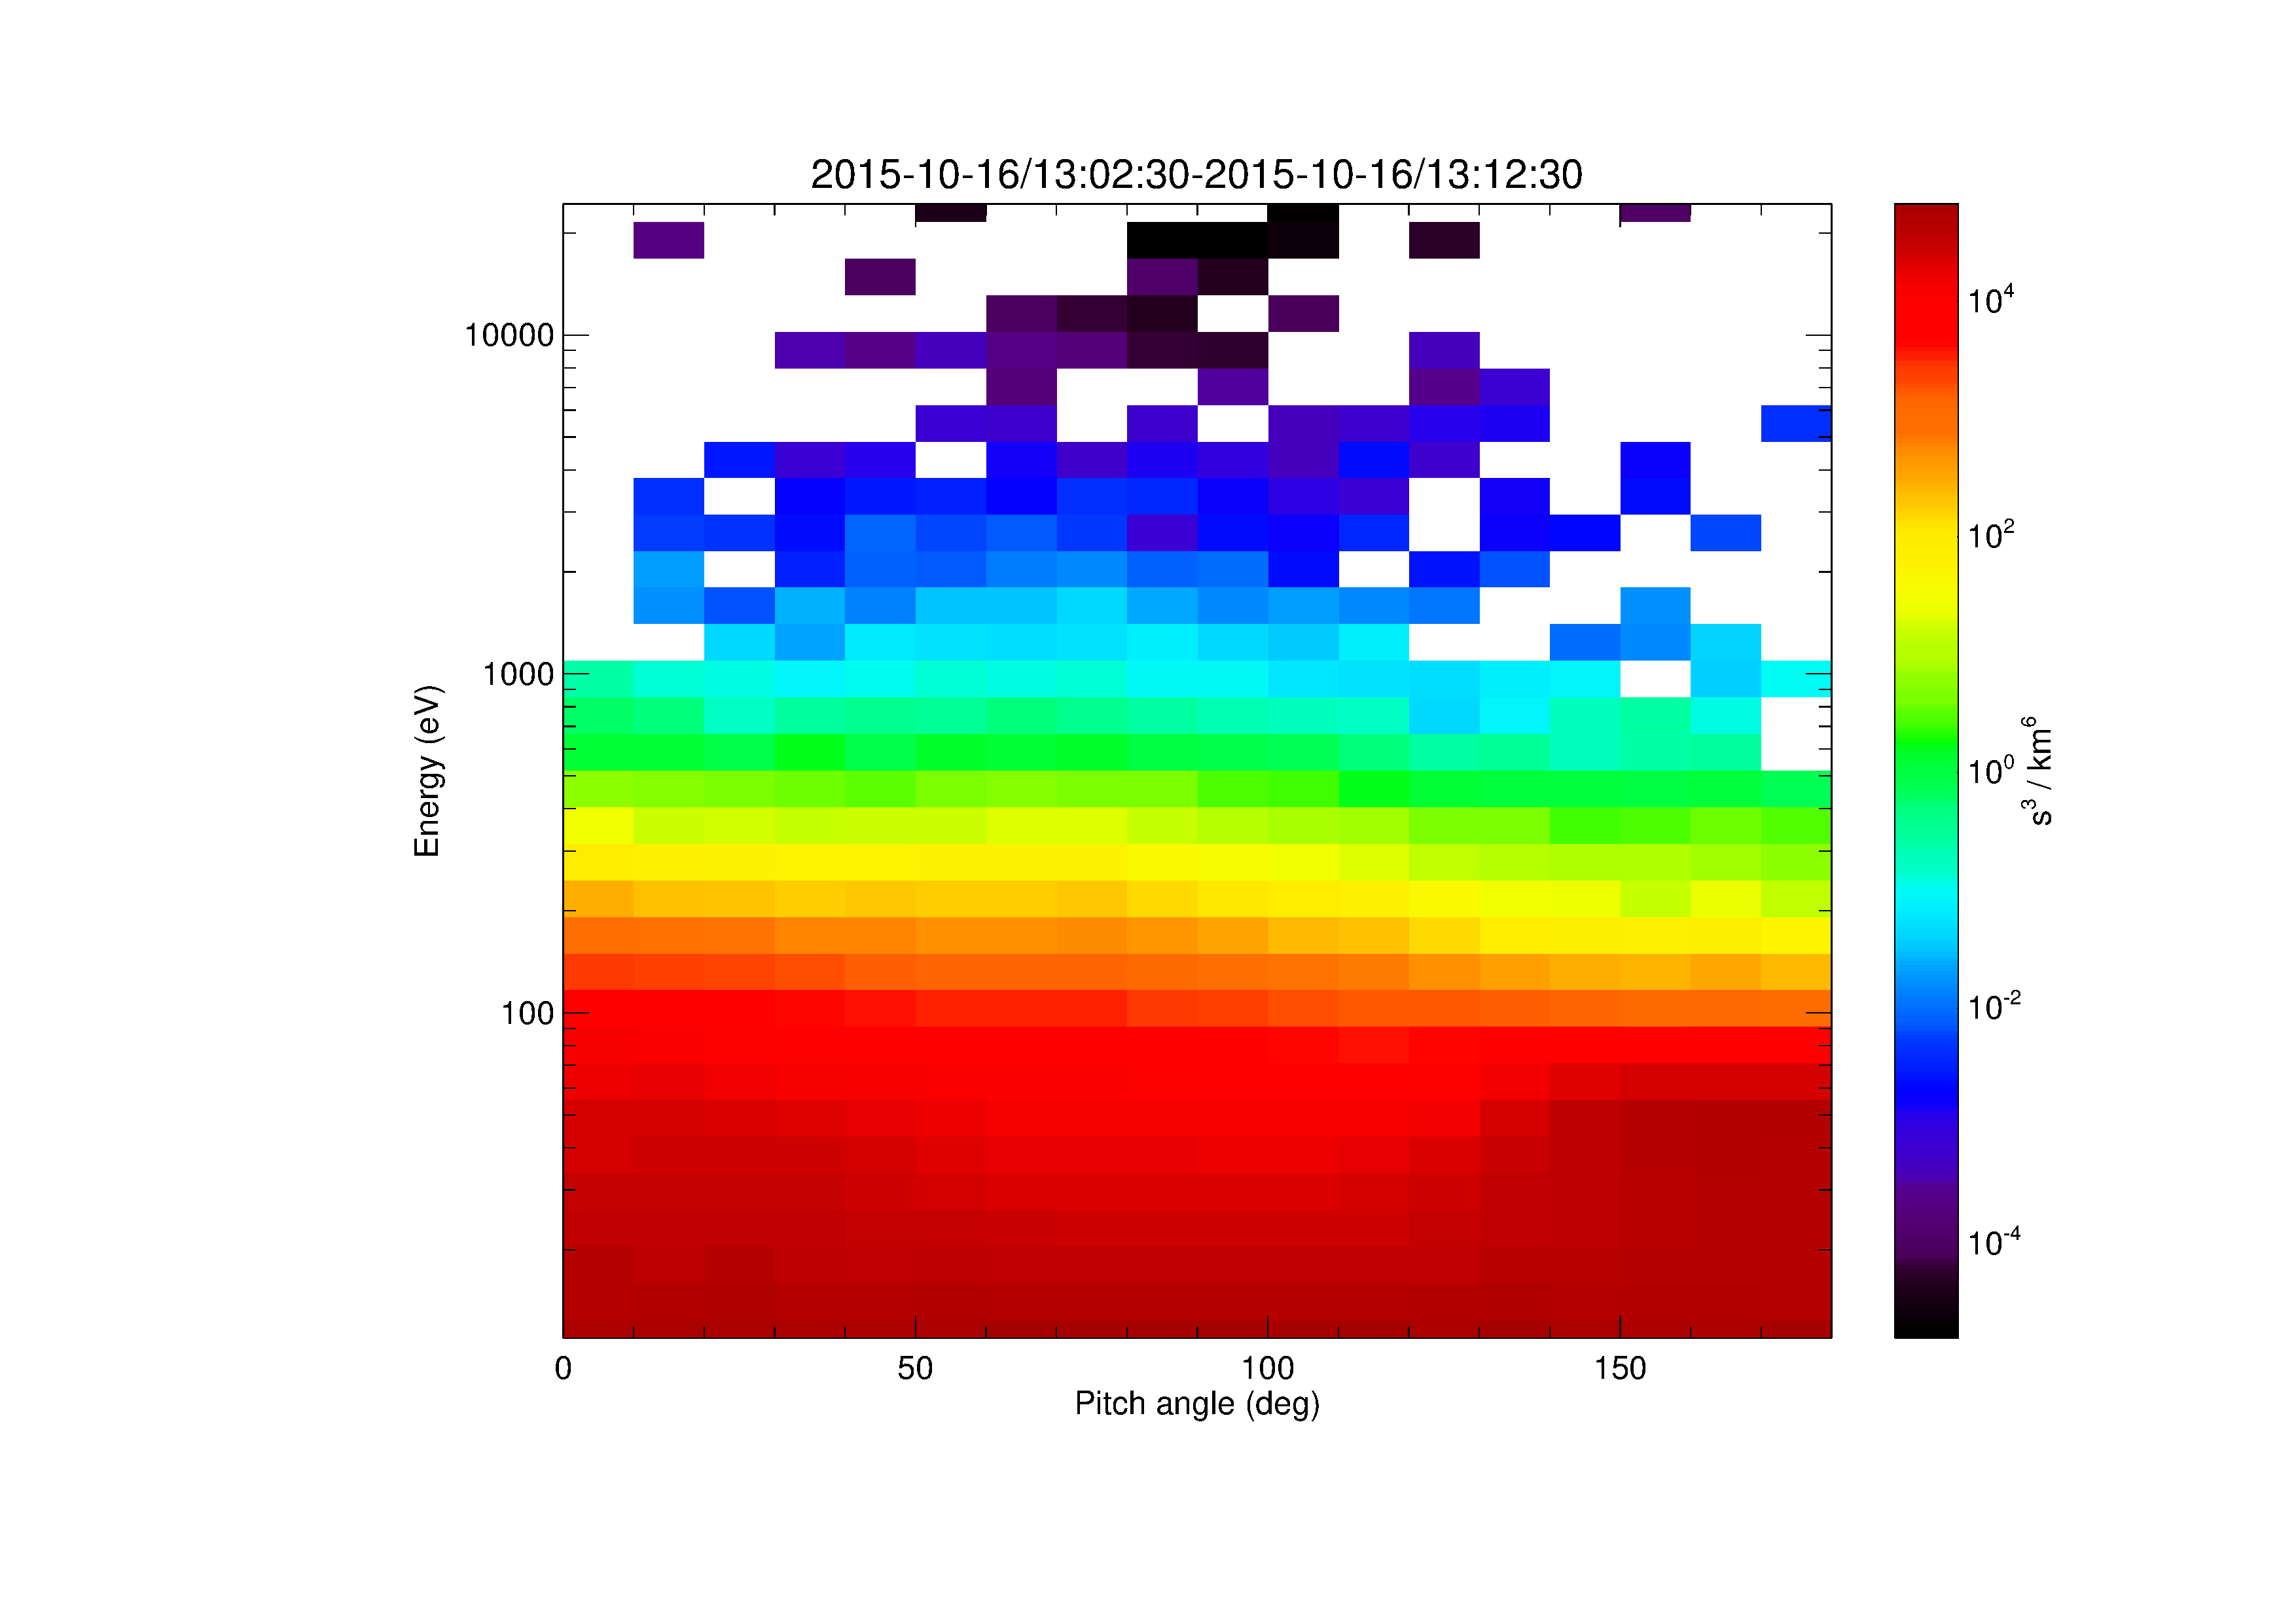
| 16:21, 18 May 2017 | Pad vs energy.png (file) |  |
64 KB | Egrimes | 1 | |
| 16:39, 18 May 2017 | Pad vs energy electrons.png (file) |  |
64 KB | Egrimes | 1 | |
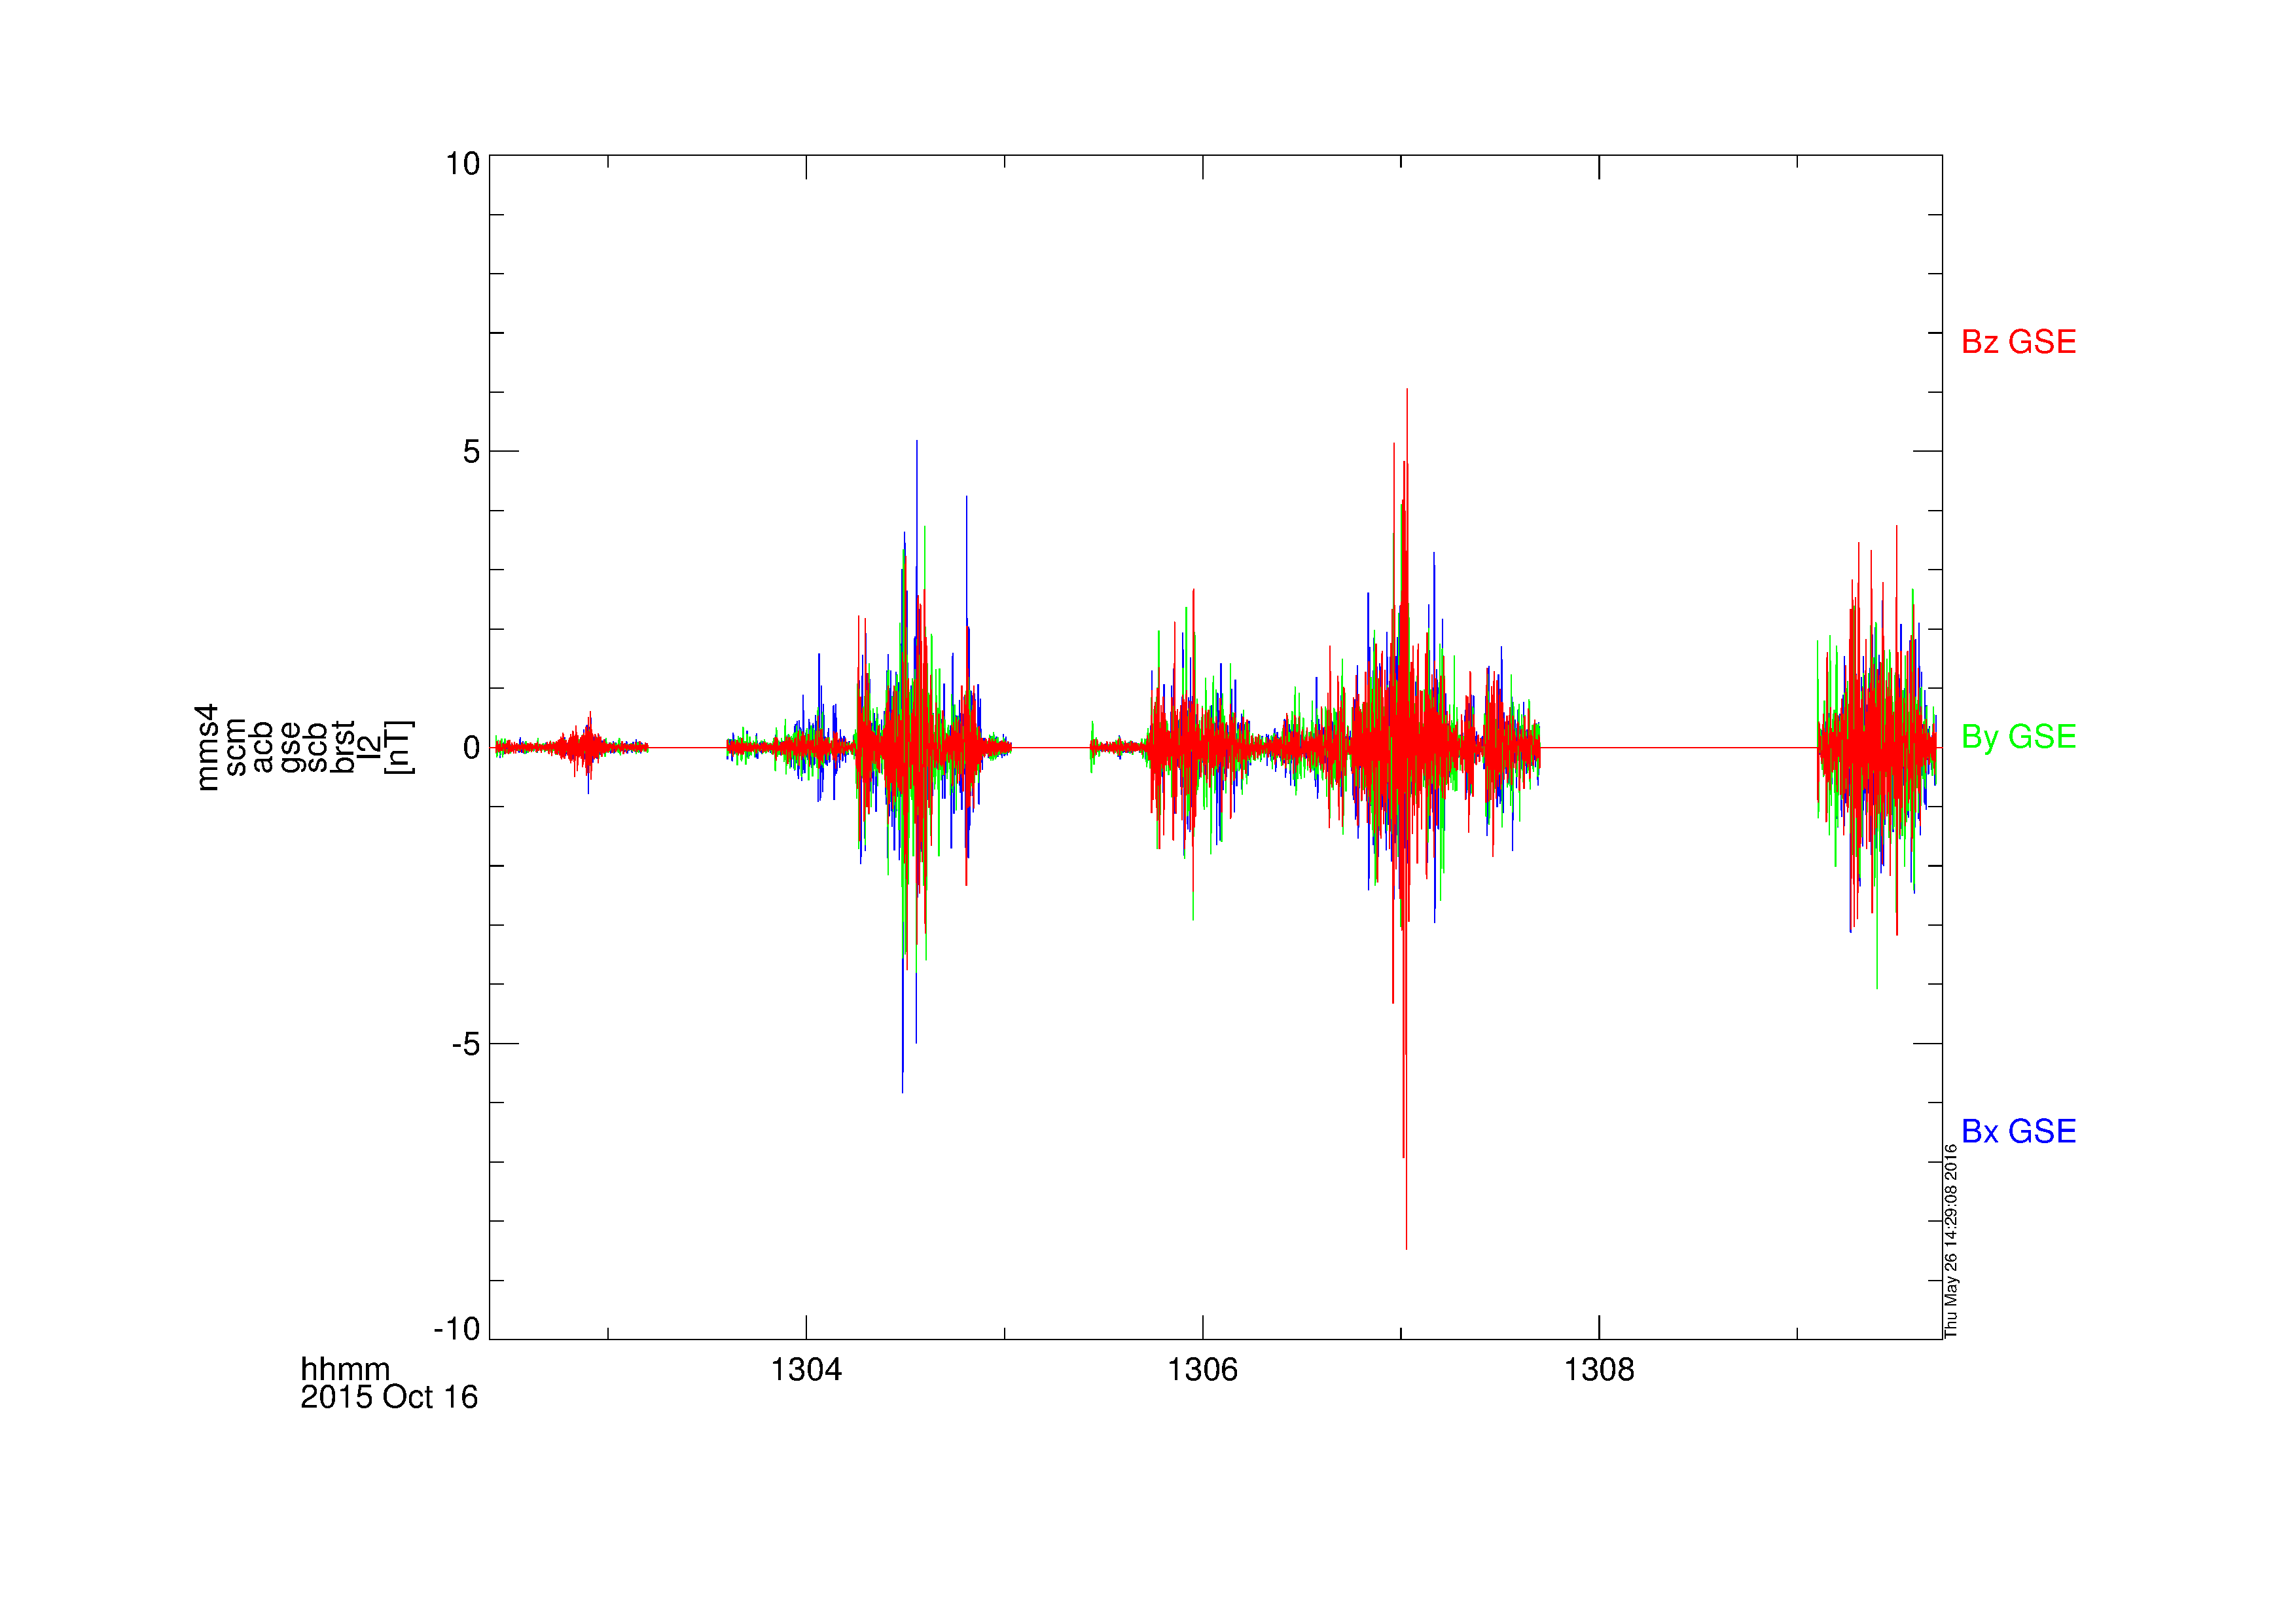
| 21:30, 26 May 2016 | Mms4 scm brst gse.png (file) |  |
64 KB | Egrimes | 1 | |
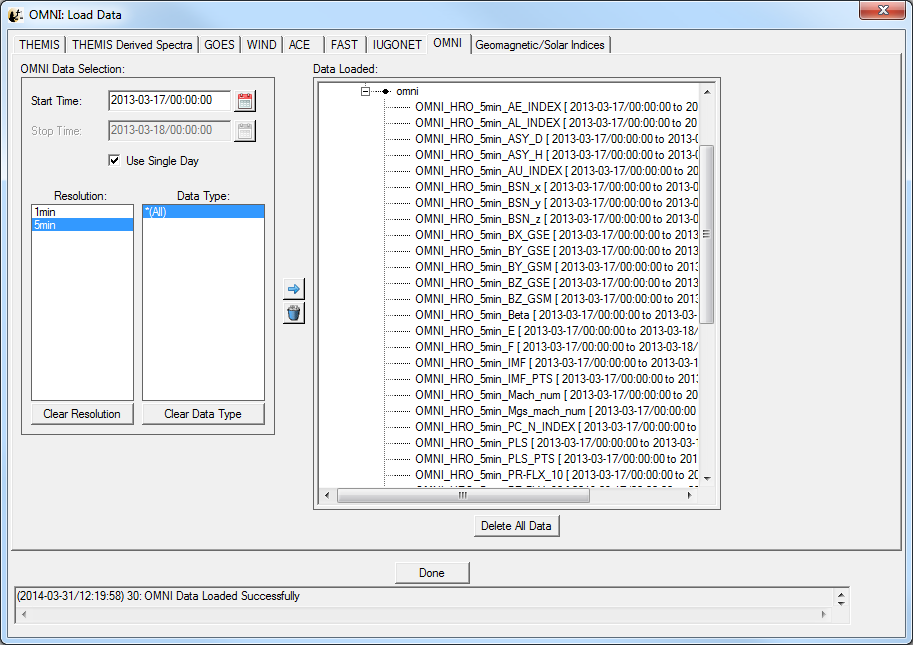
| 19:30, 31 March 2014 | Load omni data.png (file) |  |
65 KB | Egrimes | Load OMNI data | 2 |
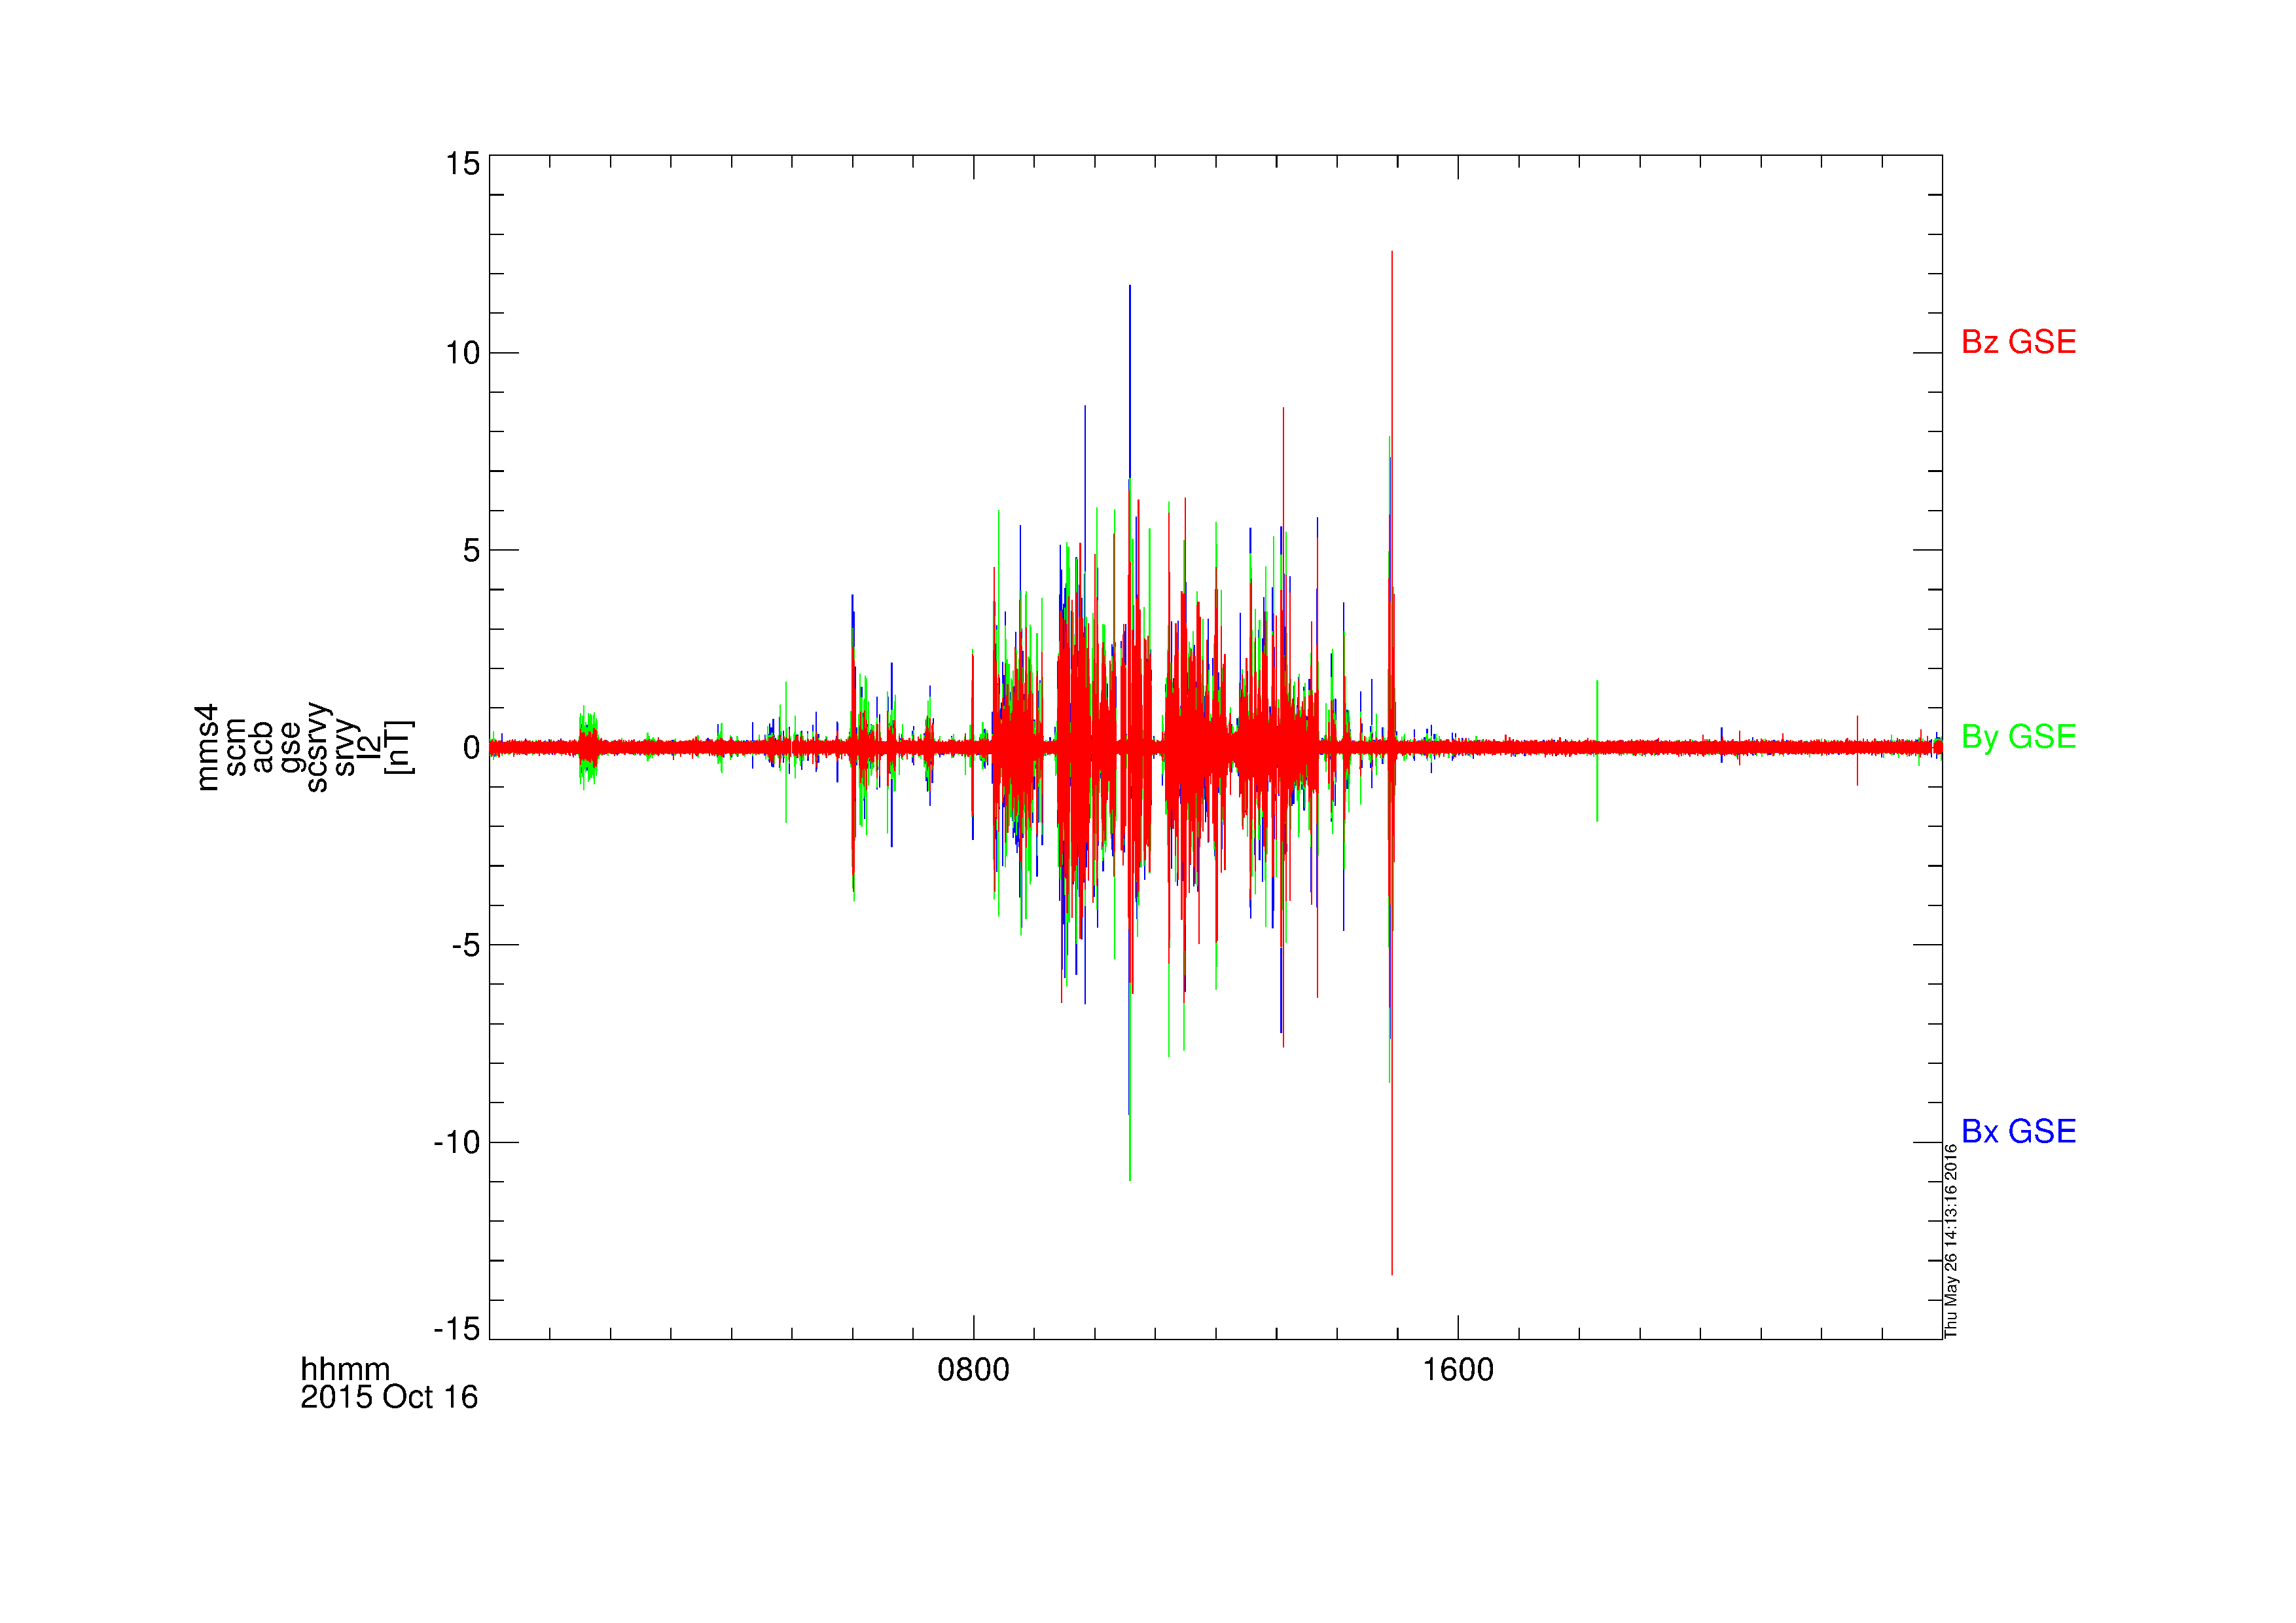
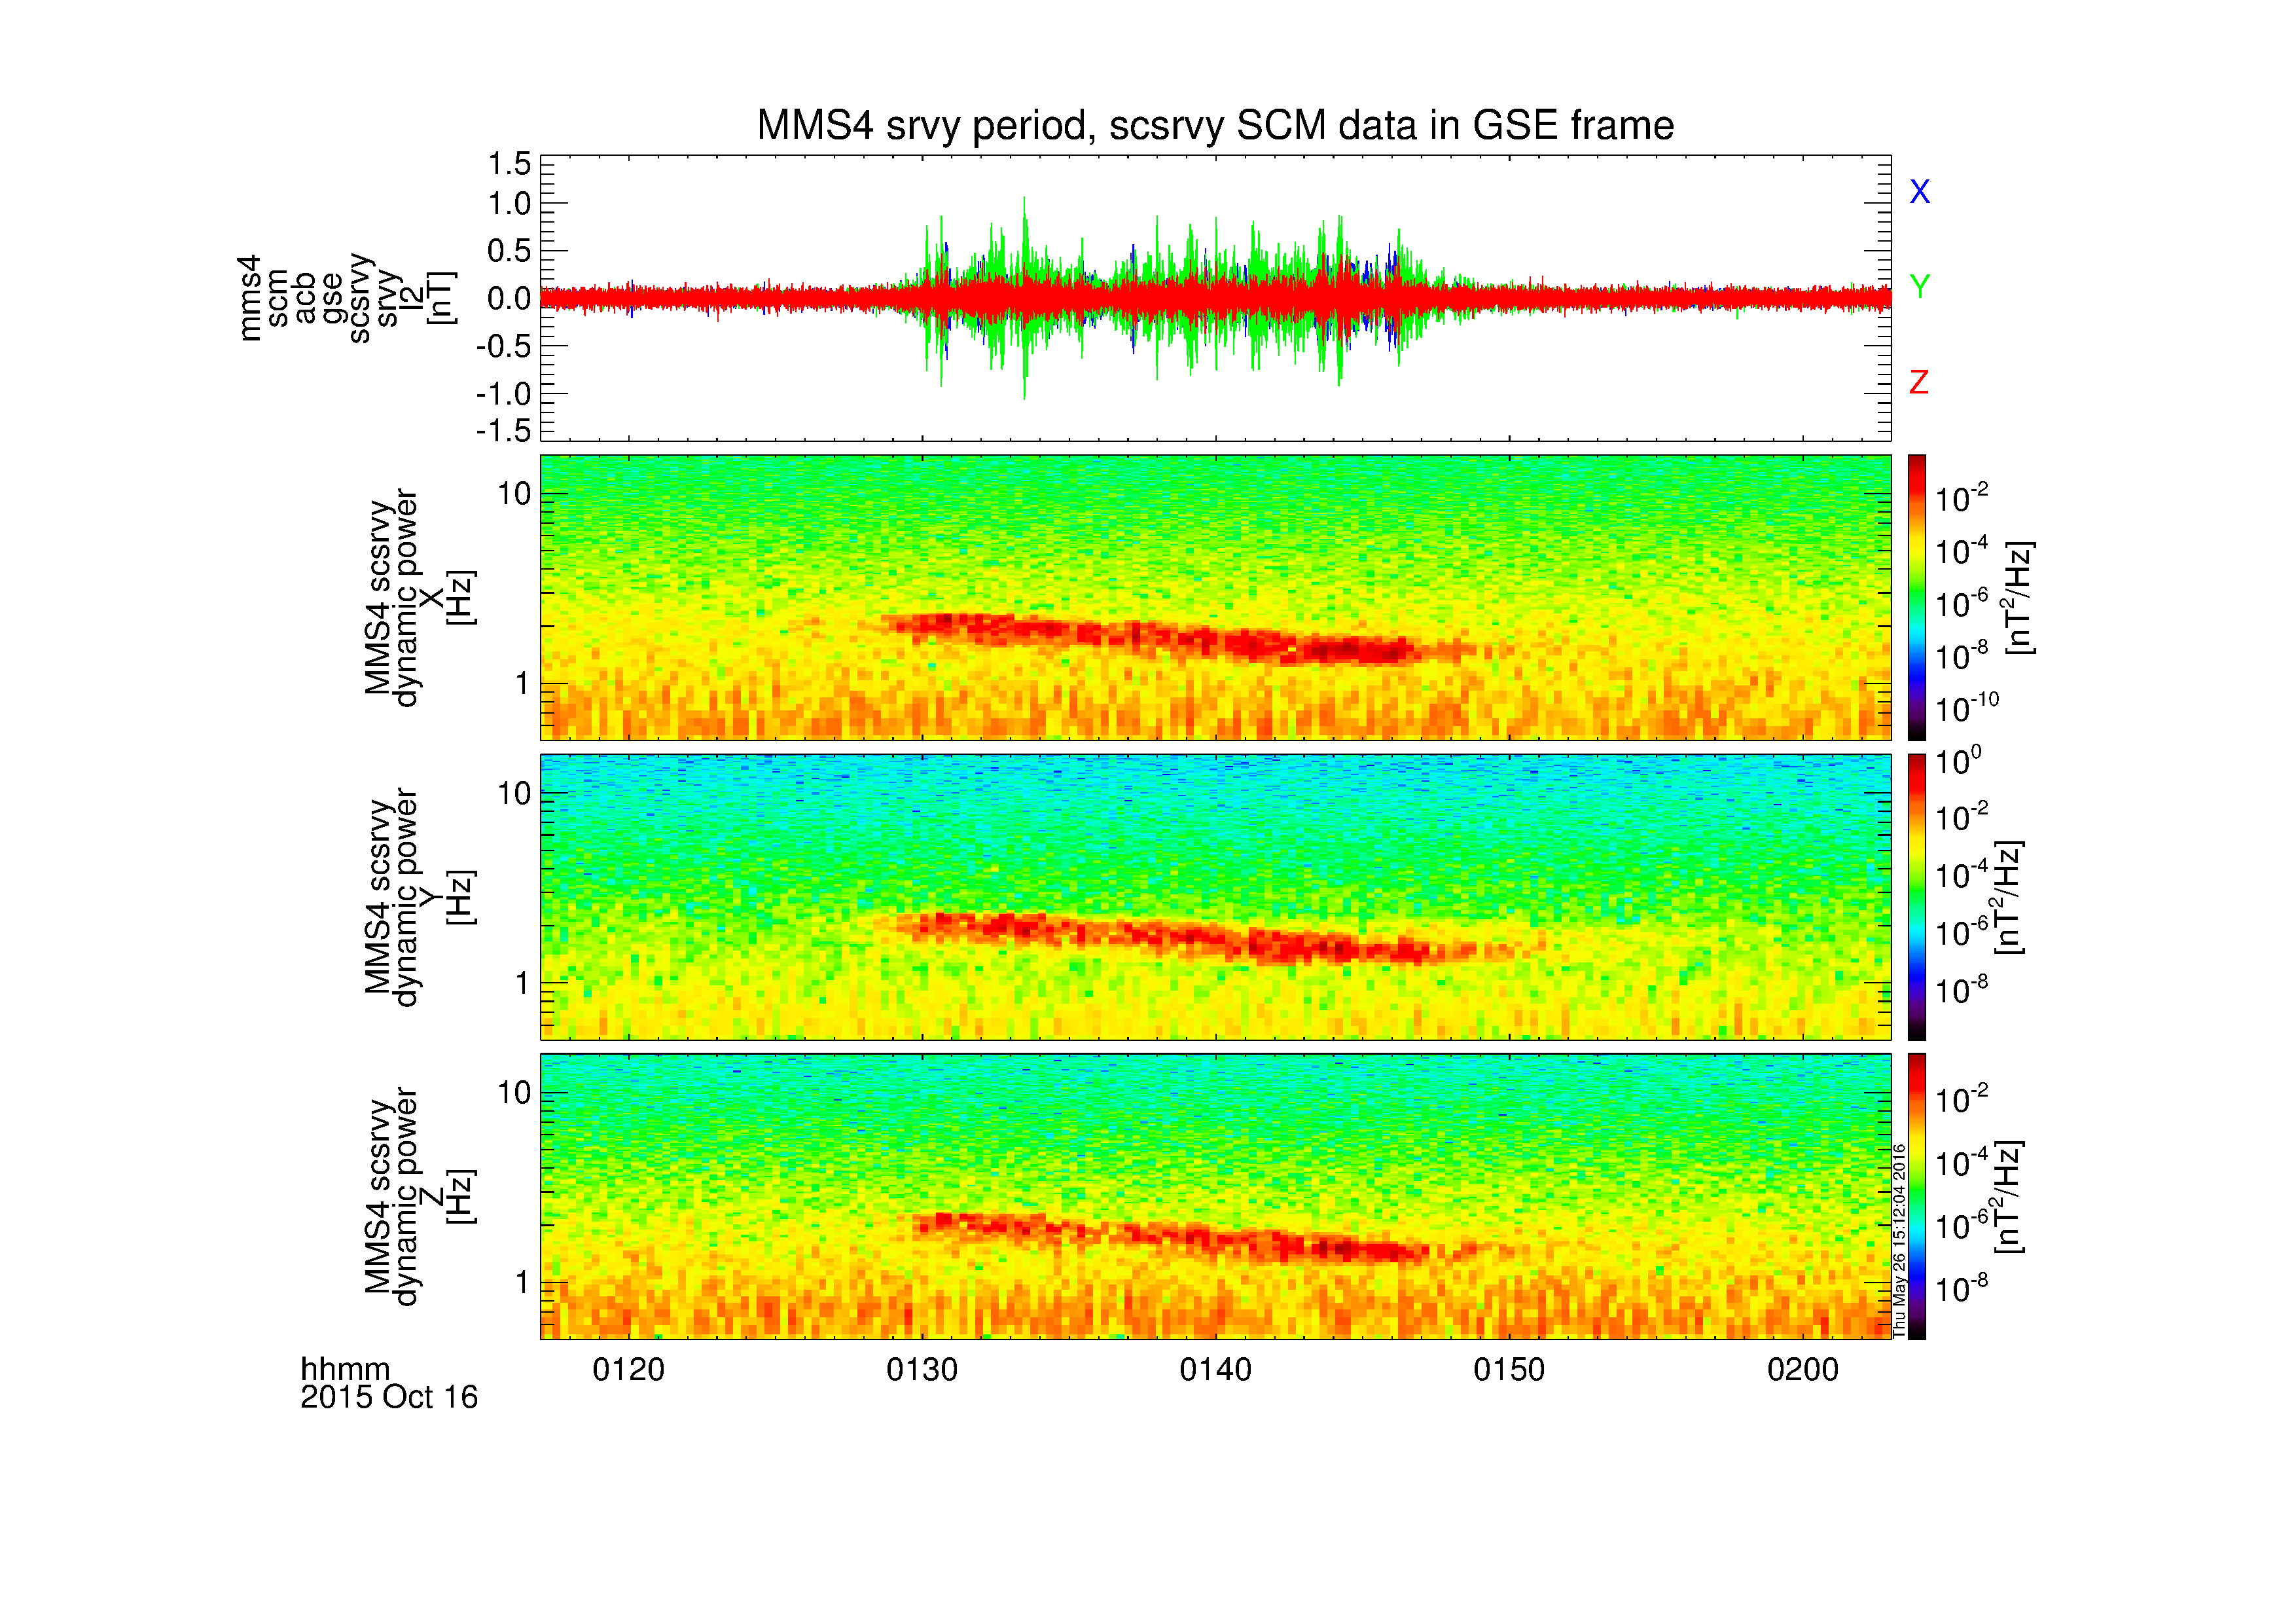
| 21:15, 26 May 2016 | Mms4 scm srvy gse.png (file) |  |
66 KB | Egrimes | 2 | |
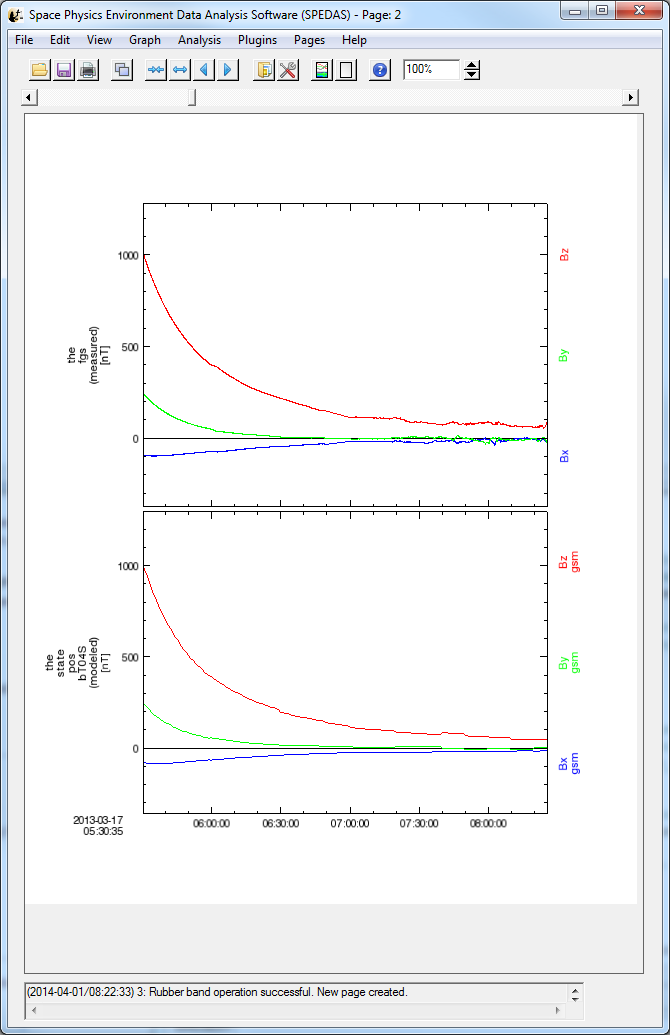
| 15:26, 1 April 2014 | The ts04 comp fgs.png (file) |  |
68 KB | Egrimes | Comparison of the magnetic field measured by THEMIS-e (top) and modeled at the THEMIS-e position using the TS04 model | 1 |
| 15:03, 28 June 2018 | 3.8.5.png (file) |  |
69 KB | Clrussell | 2 | |
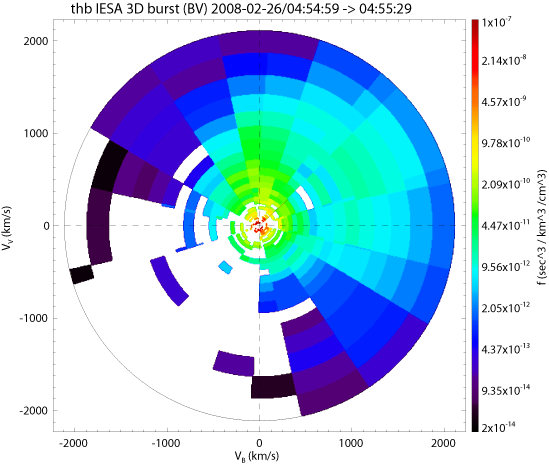
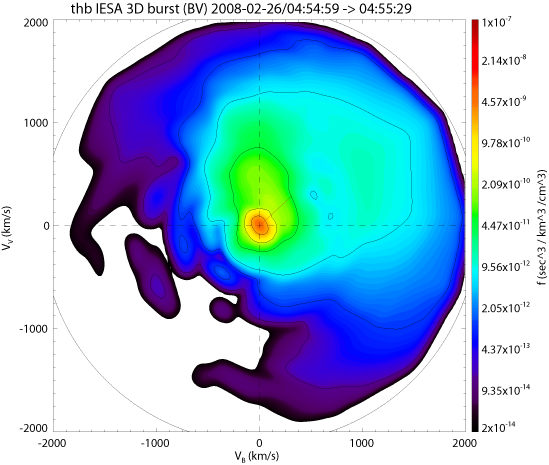
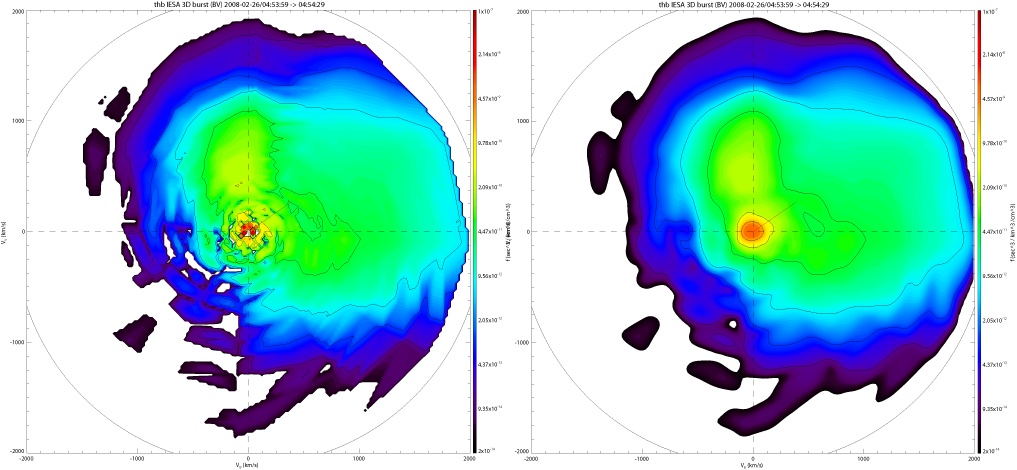
| 21:42, 20 August 2014 | Themis slice2d geo bv example.png (file) |  |
71 KB | Floresaa | Basic example of a THEMIS particle distribution slice using the geometric method for ESA ion burst data. The x axis is parallel to the magnetic field, the y axis is defined such that the slice plane contains the bulk velocity vector (red). | 1 |
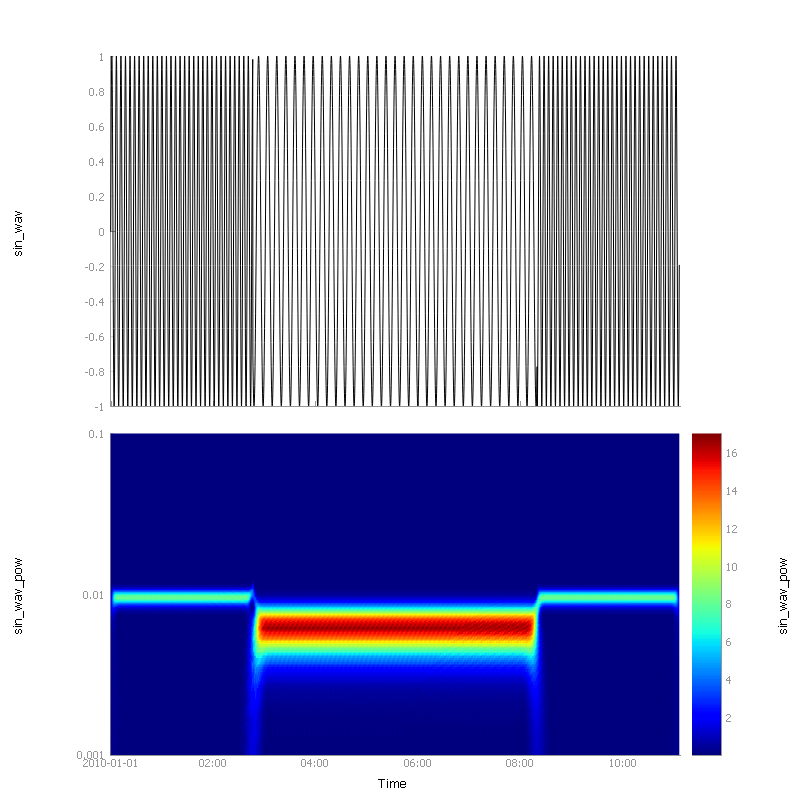
| 03:12, 3 May 2020 | Py sin wavelet.png (file) |  |
72 KB | Nikos | Python wavelet transformation for simple wave. | 1 |
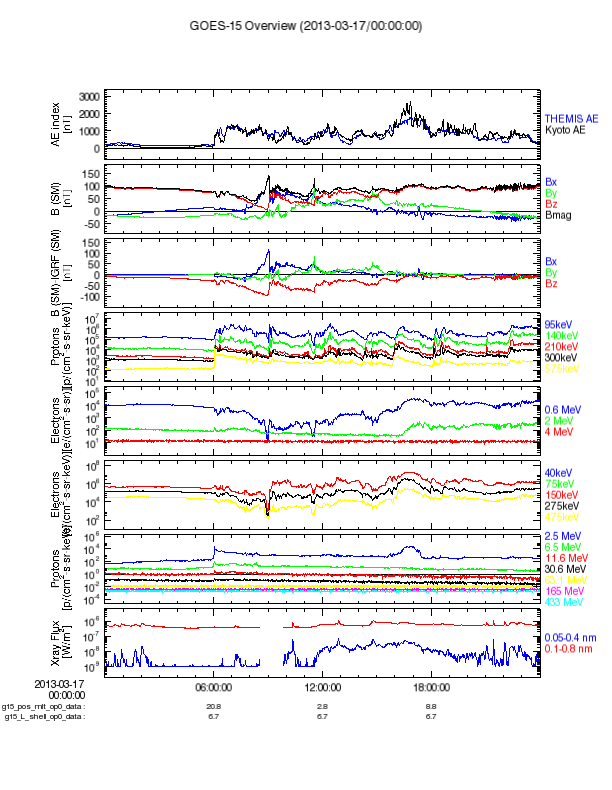
| 16:26, 31 March 2014 | Goes15 overview plot.png (file) |  |
72 KB | Egrimes | GOES-15 overview plot | 1 |
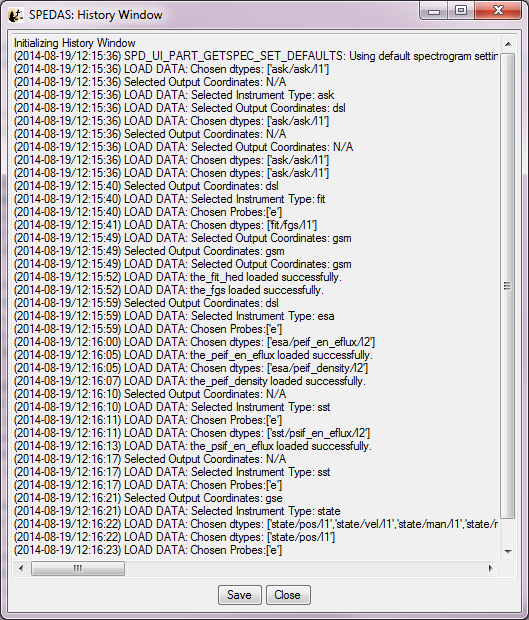
| 19:17, 19 August 2014 | History window gui.png (file) |  |
76 KB | Egrimes | SPEDAS history window | 1 |
| 16:38, 27 May 2016 | Screen 20160527093648.png (file) |  |
80 KB | Egrimes | 1 | |
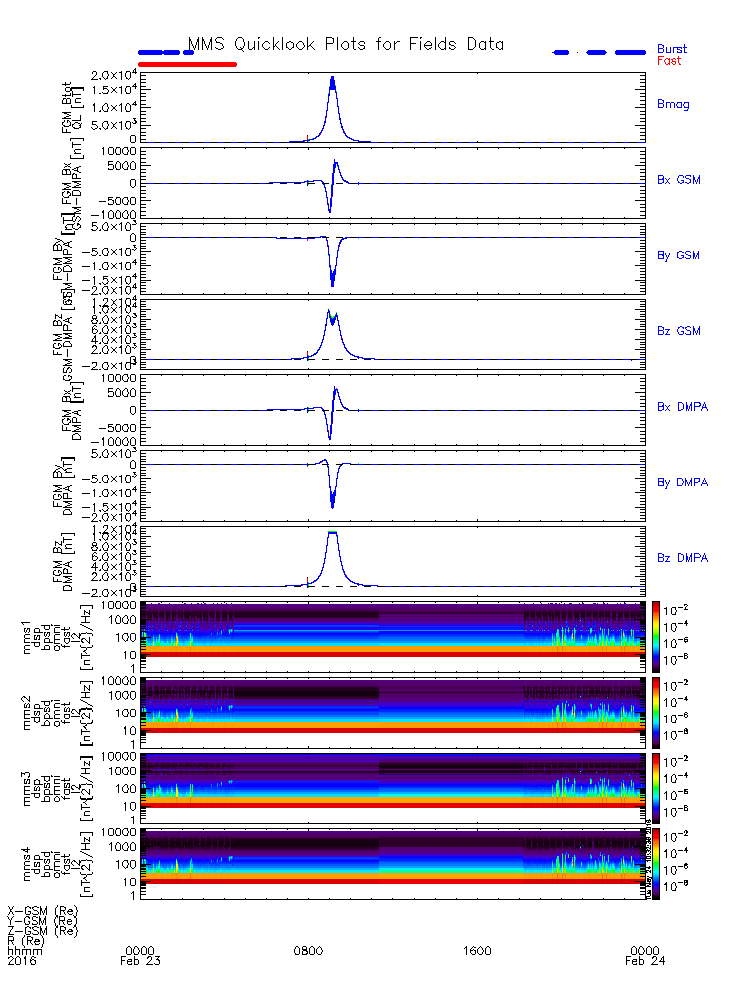
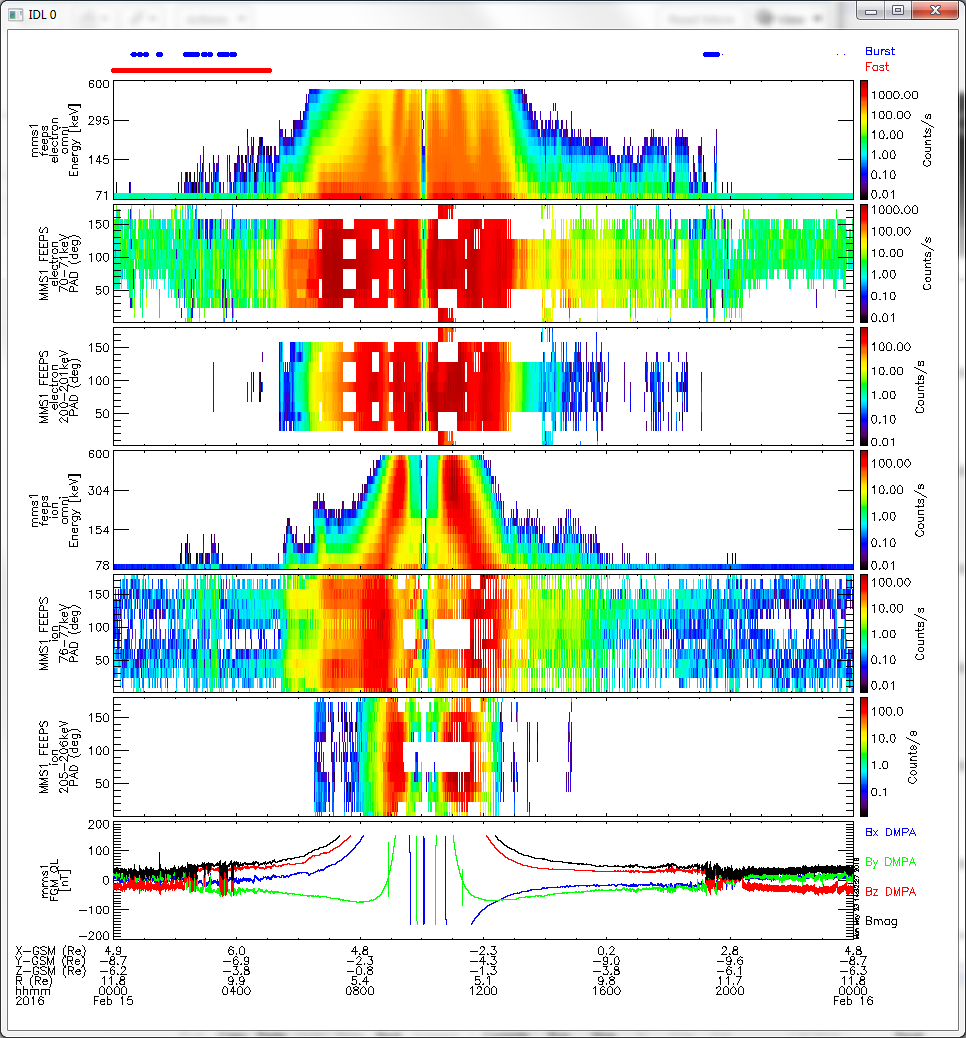
| 18:14, 24 May 2016 | FGM QuickLook Plots.png (file) |  |
81 KB | Clrussell | Flux Gate Magnetometer Quick Look Plots | 1 |
| 18:51, 4 September 2014 | Peef moments example.png (file) |  |
88 KB | Floresaa | Example plot of THEMIS ESA electron moments. | 1 |
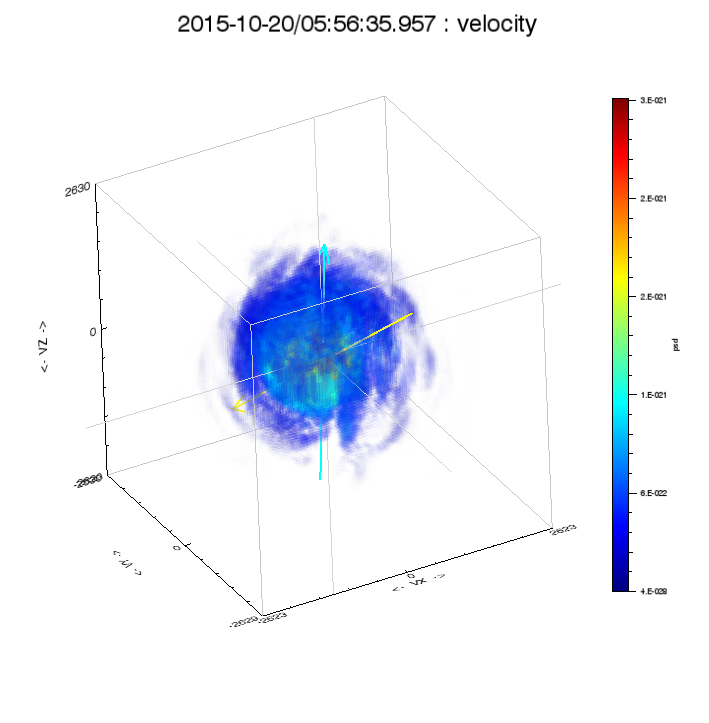
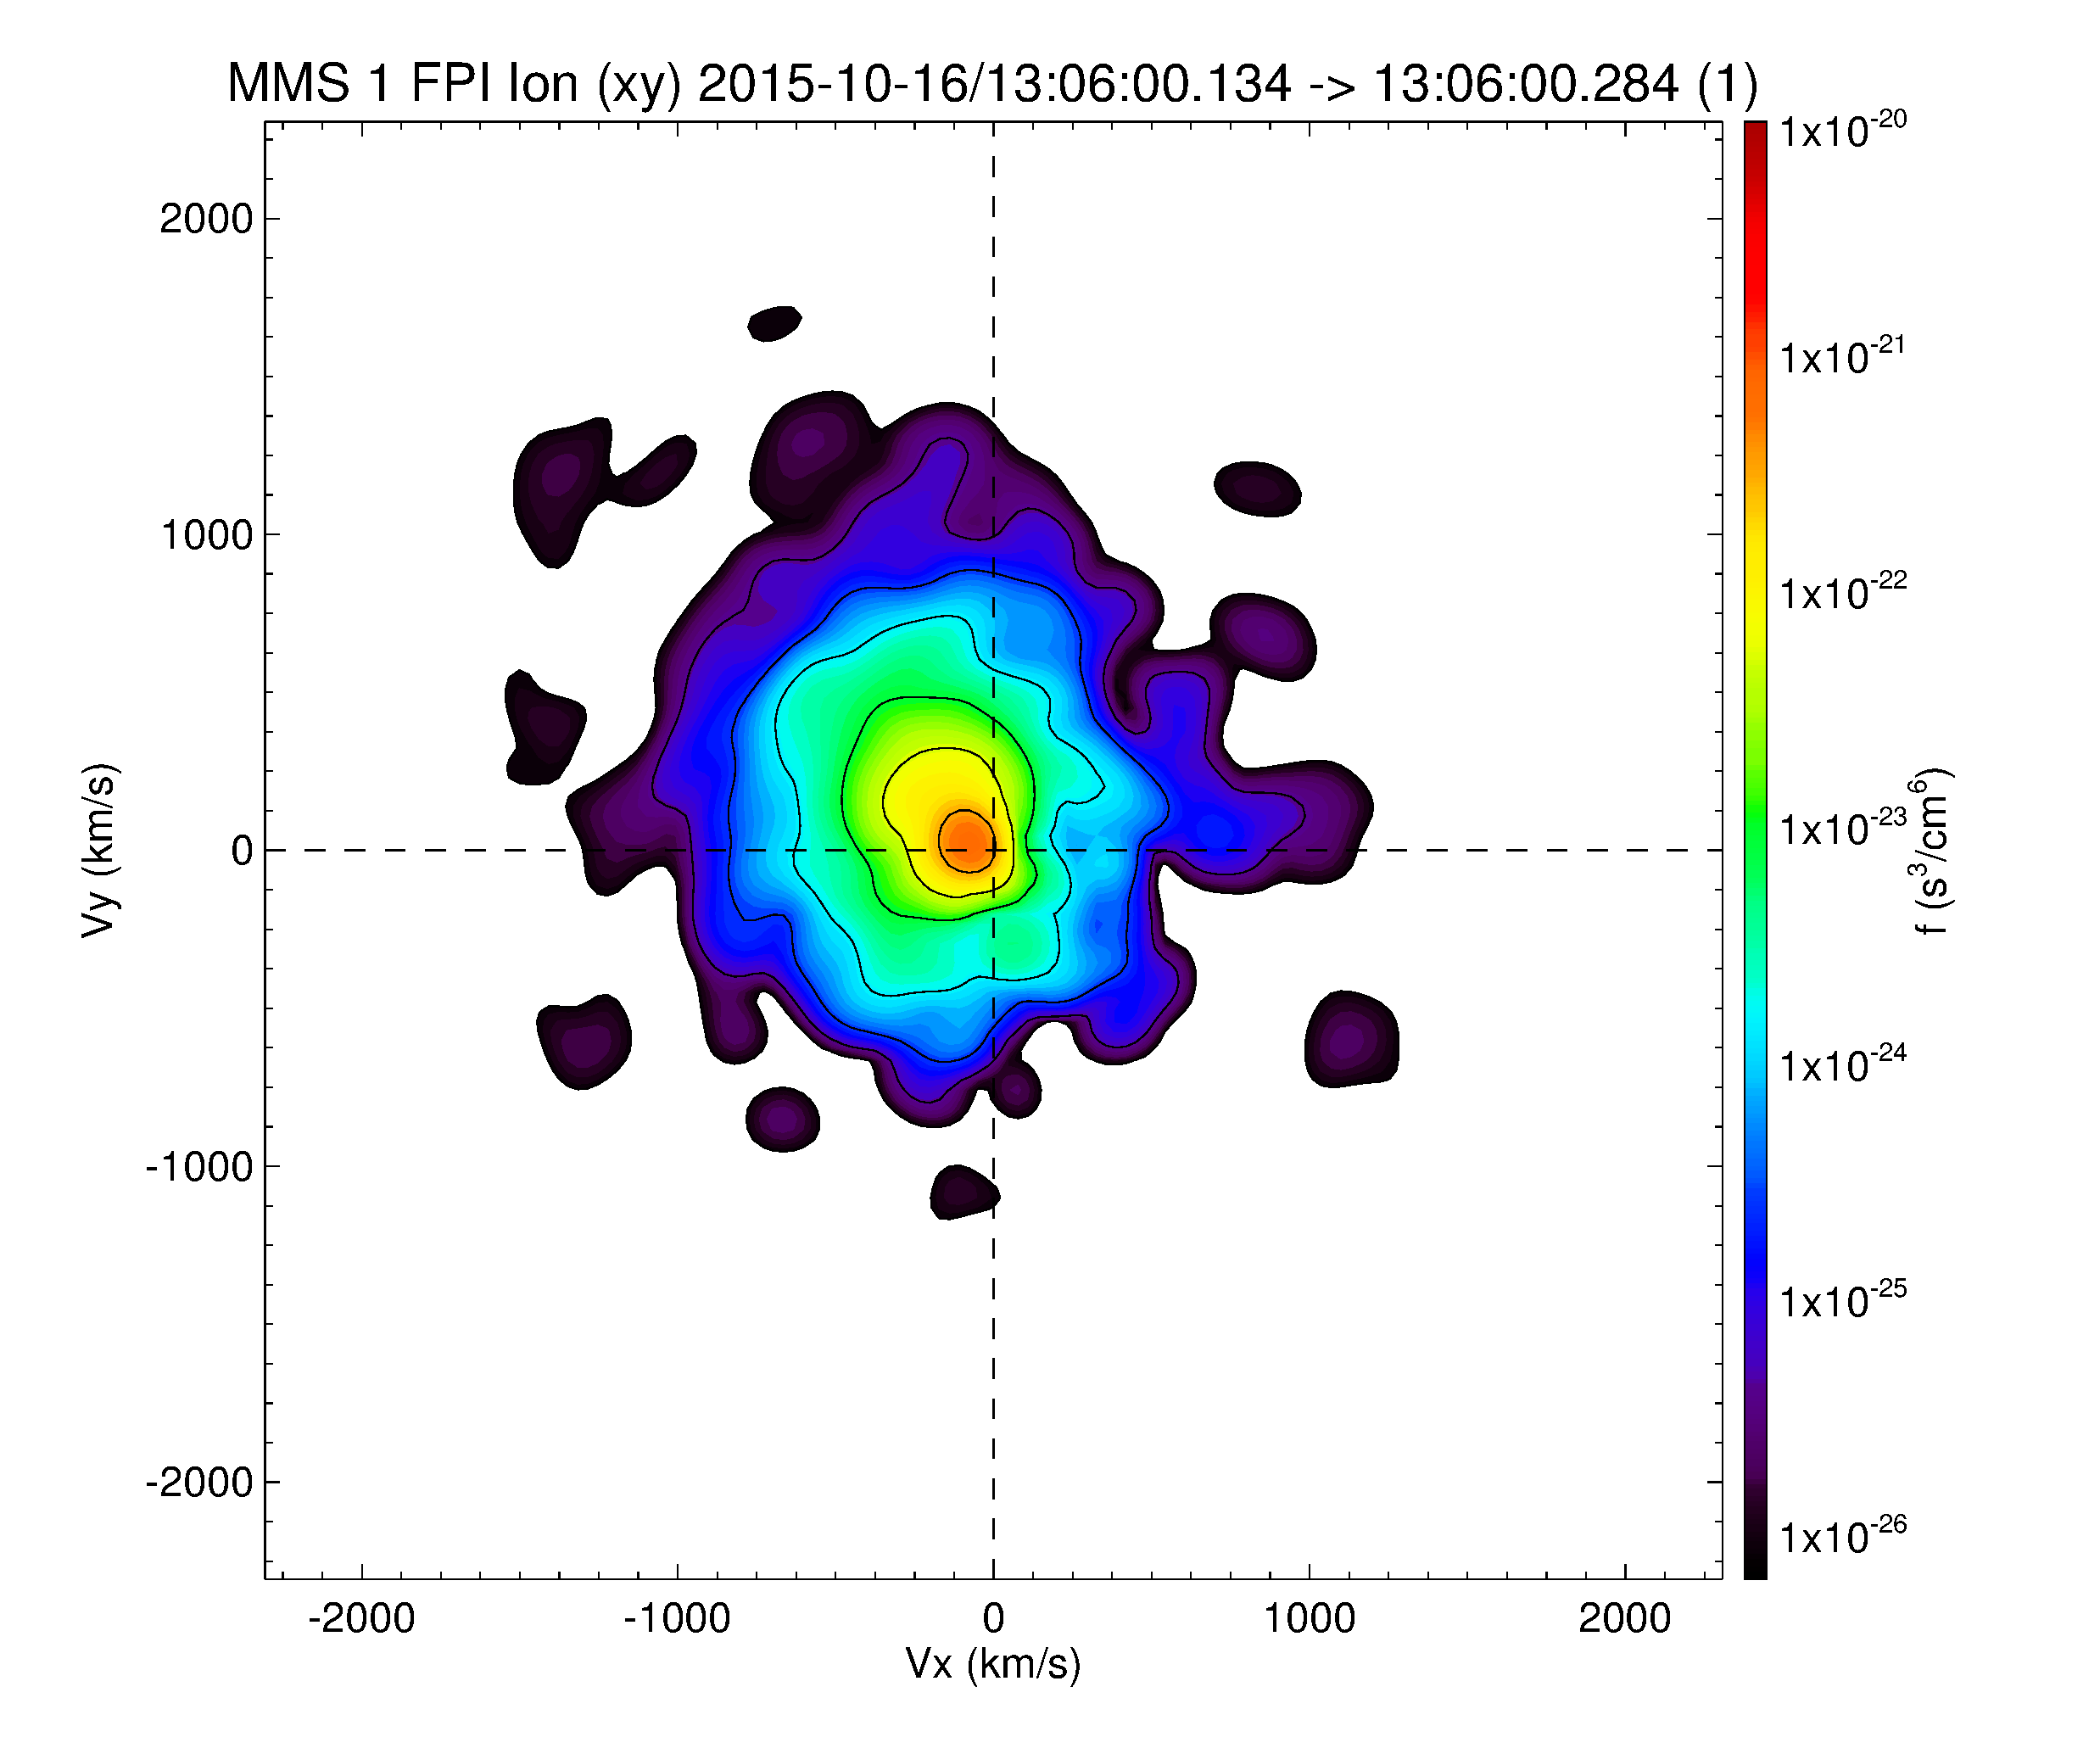
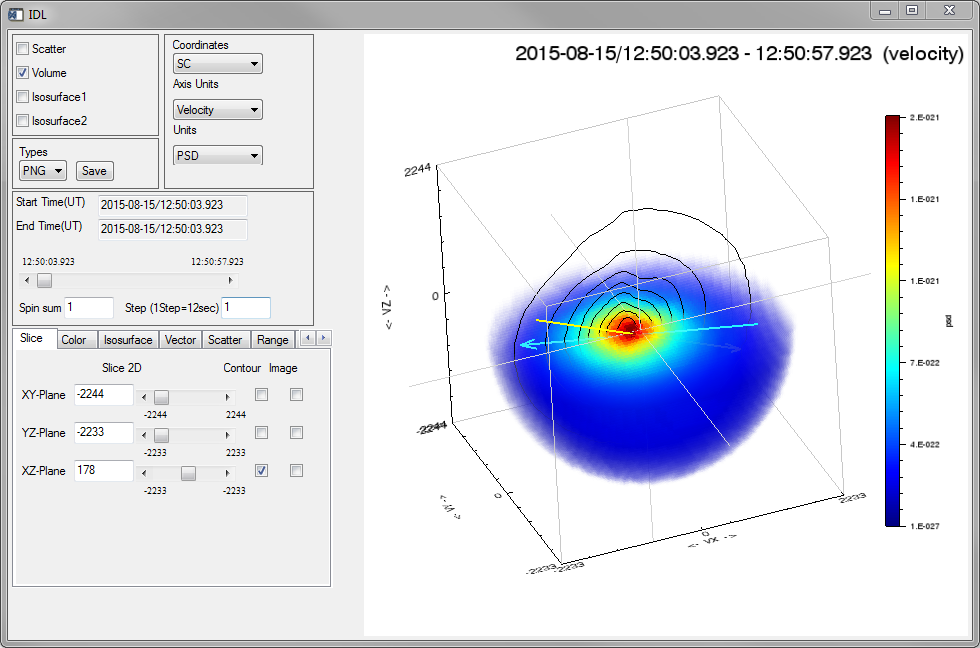
| 00:02, 12 March 2016 | Mms fpi volume.png (file) |  |
101 KB | Floresaa | Single three-dimensional MMS FPI ion distribution plotted as volume in phase space. | 1 |
| 22:14, 26 October 2018 | Spedas plots.png (file) |  |
111 KB | Nikos | Spedas 3.1 GUI | 2 |
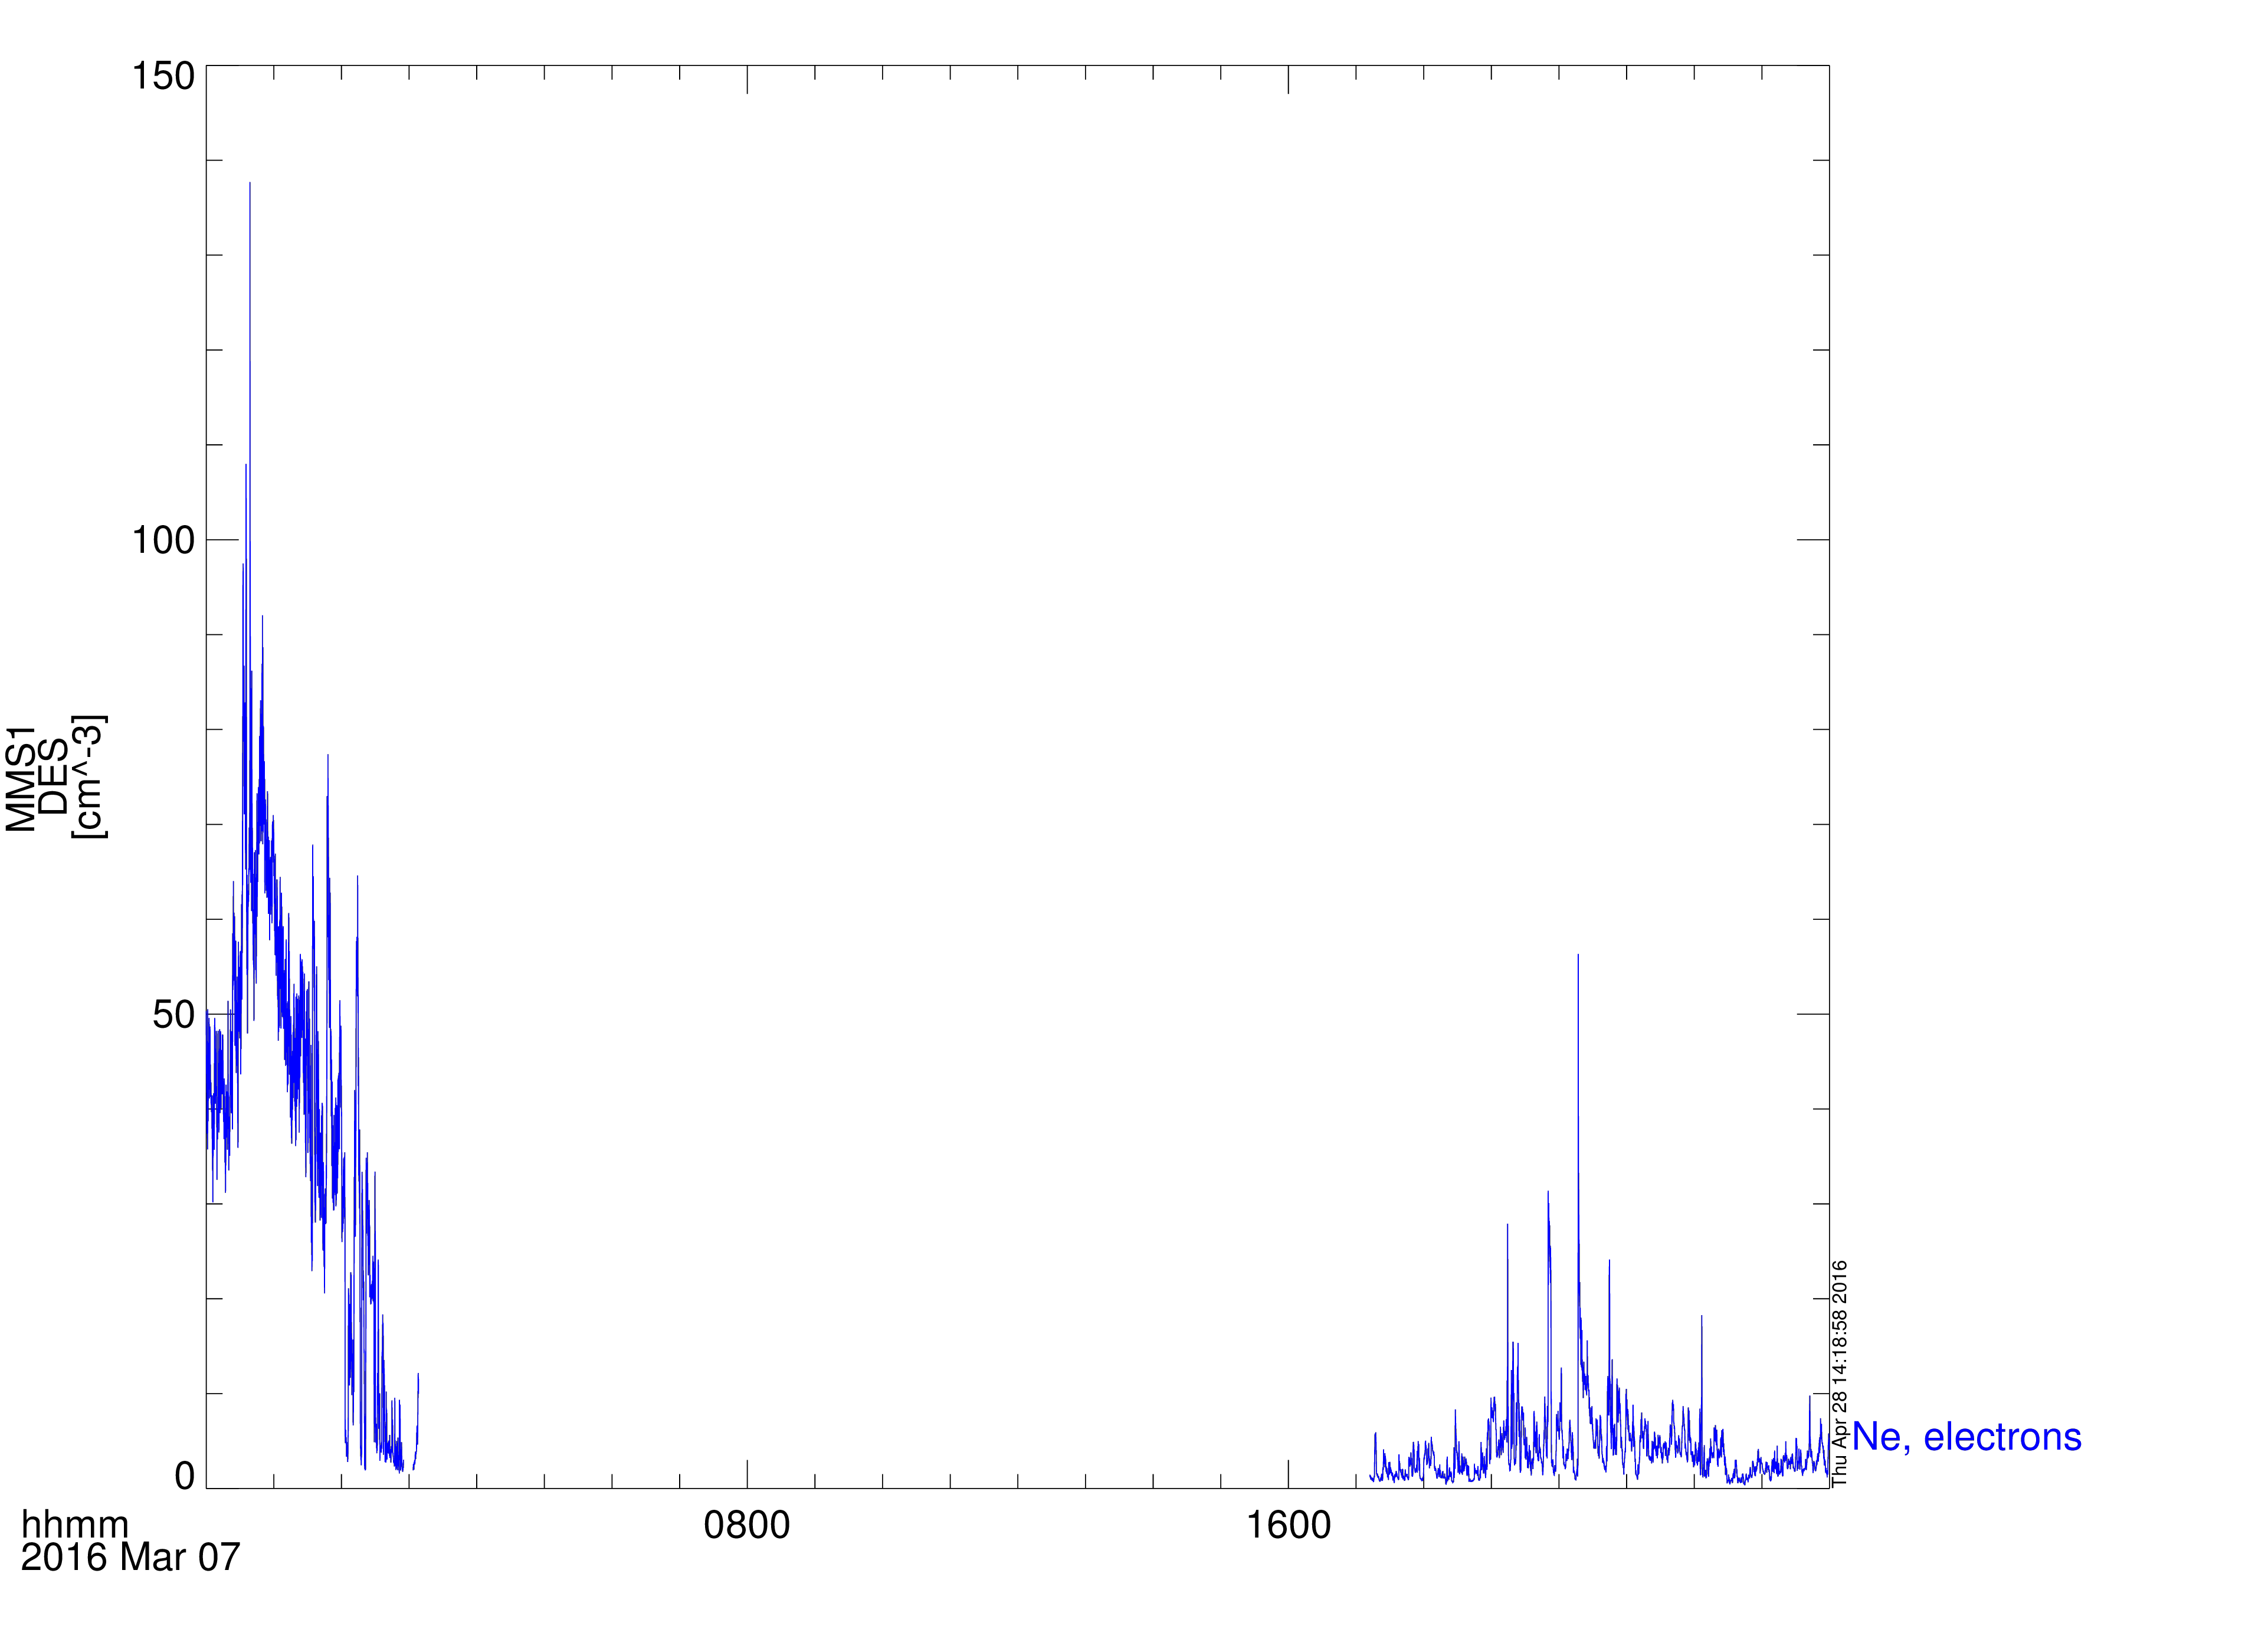
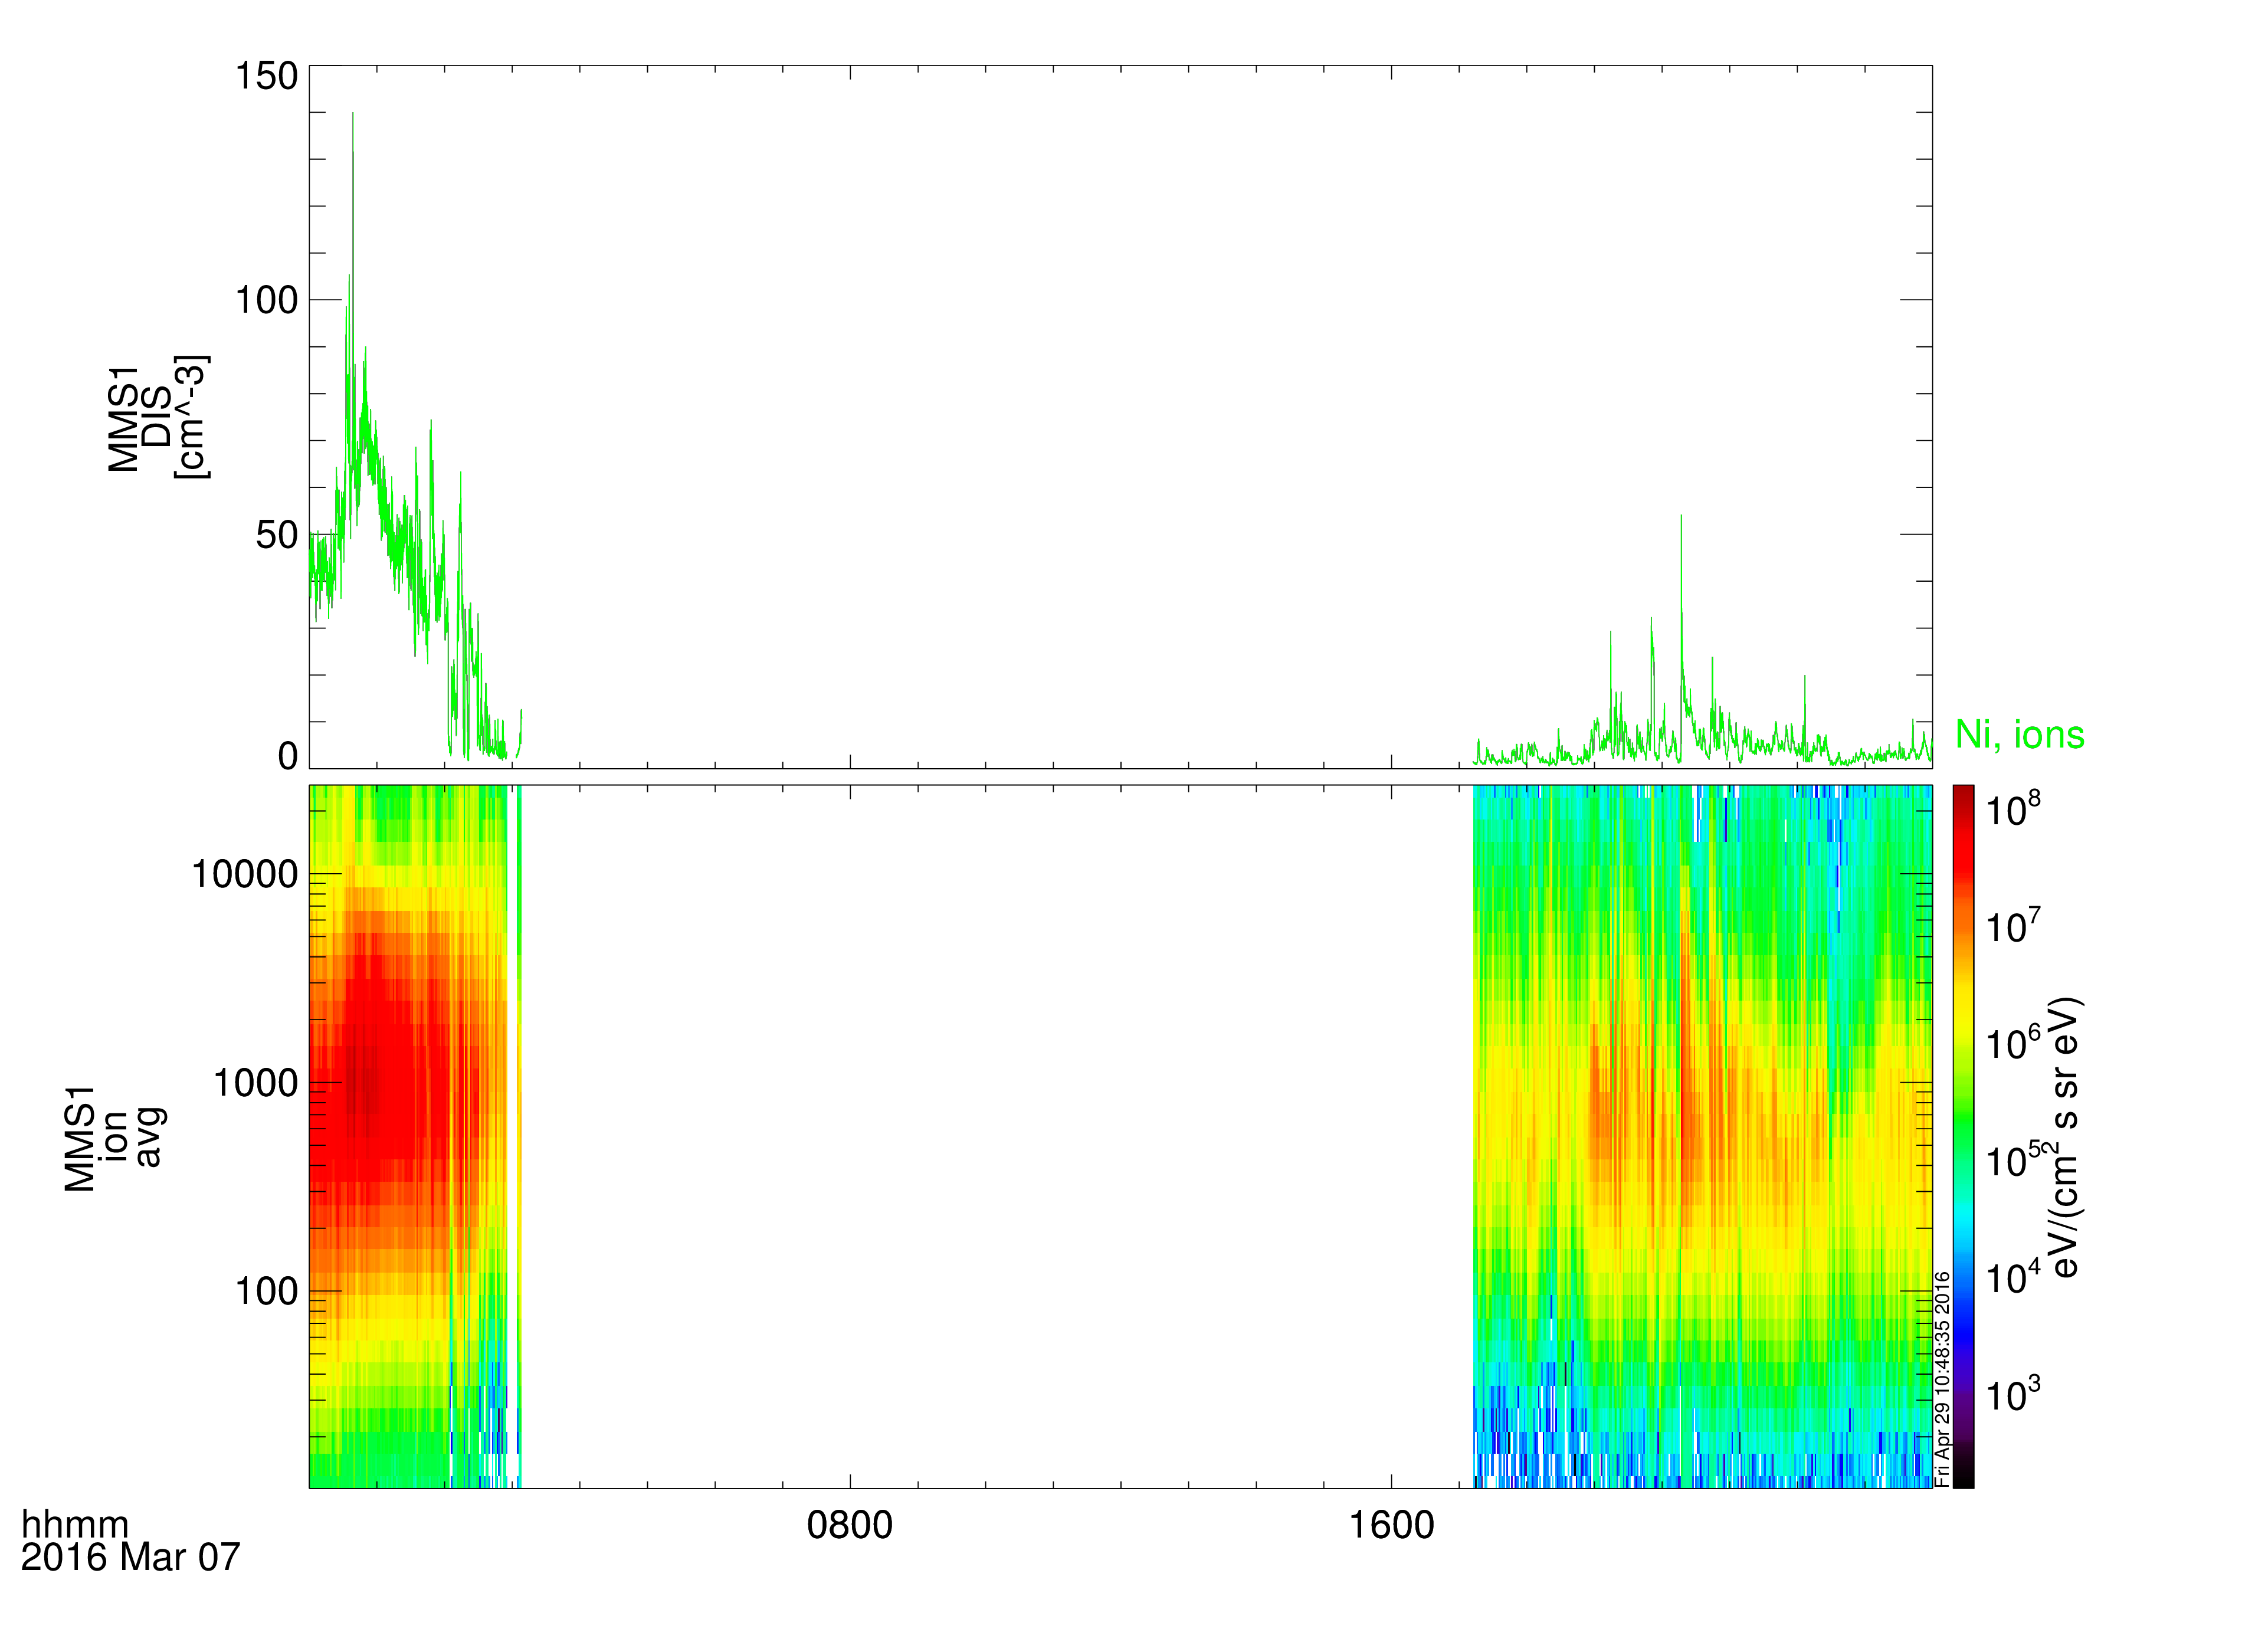
| 21:21, 28 April 2016 | Fpi electron density2.png (file) |  |
113 KB | Egrimes | FPI electron density on March 7, 2016 | 1 |
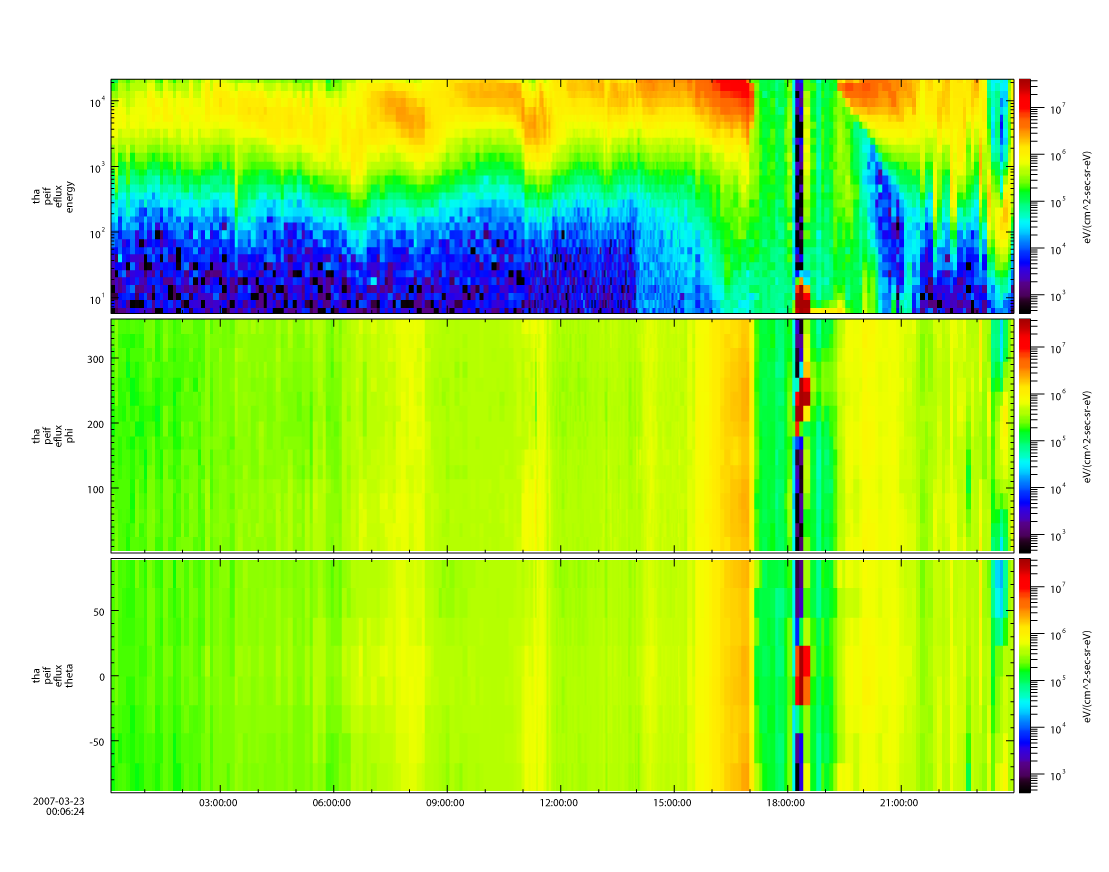
| 01:18, 22 August 2014 | Thm esa spec.png (file) |  |
117 KB | Floresaa | Energy, phi, and theta spectrograms for ESA ion data. | 1 |
| 20:23, 8 May 2018 | 3.6.5.png (file) |  |
119 KB | Clrussell | Reverted to version as of 19:36, 8 May 2018 | 6 |
| 22:57, 27 May 2016 | Hpca espec.png (file) |  |
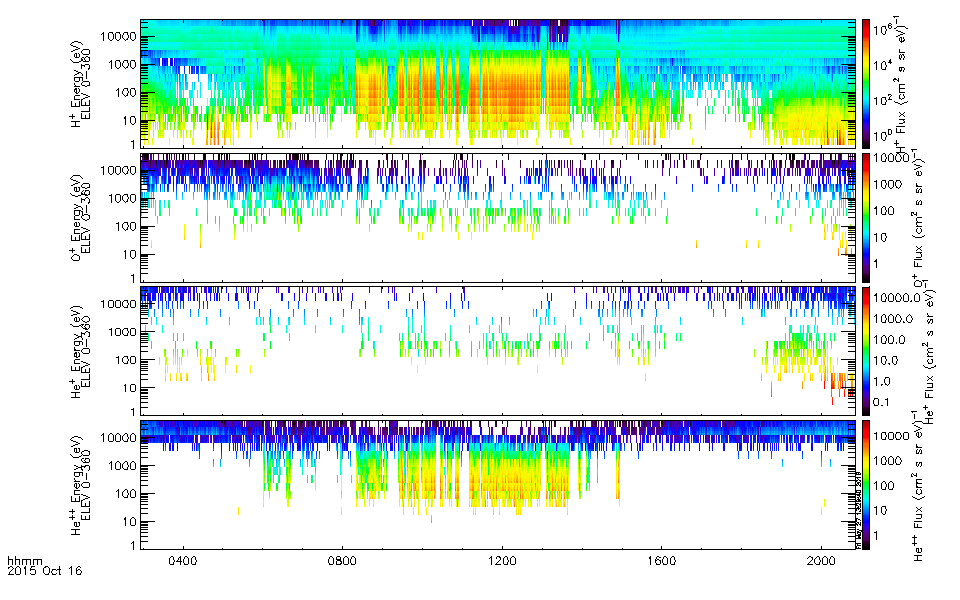
120 KB | Floresaa | Example of HPCA ion energy spectra available from mms_load_hpca. Displayed: H+, O+, He+, and He++ energy spectrograms. | 1 |
| 17:25, 14 August 2014 | Gui markers.png (file) |  |
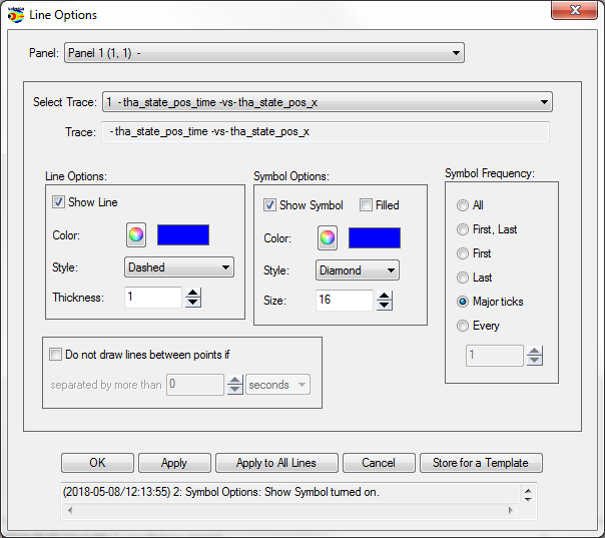
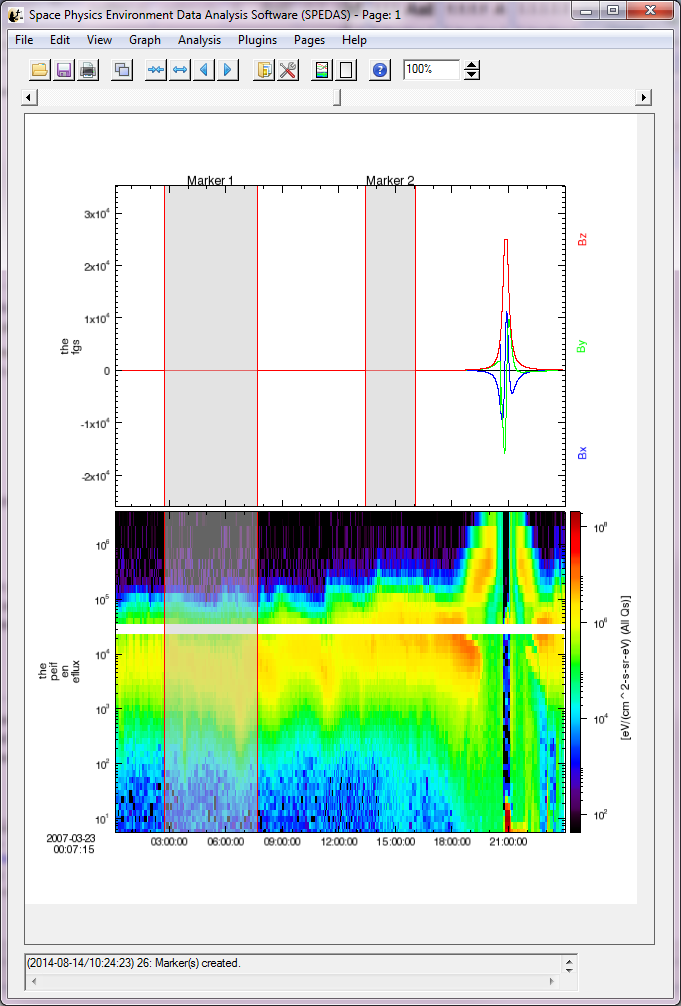
122 KB | Egrimes | 1 | |
| 16:51, 14 May 2018 | Mms data in autoplot.png (file) |  |
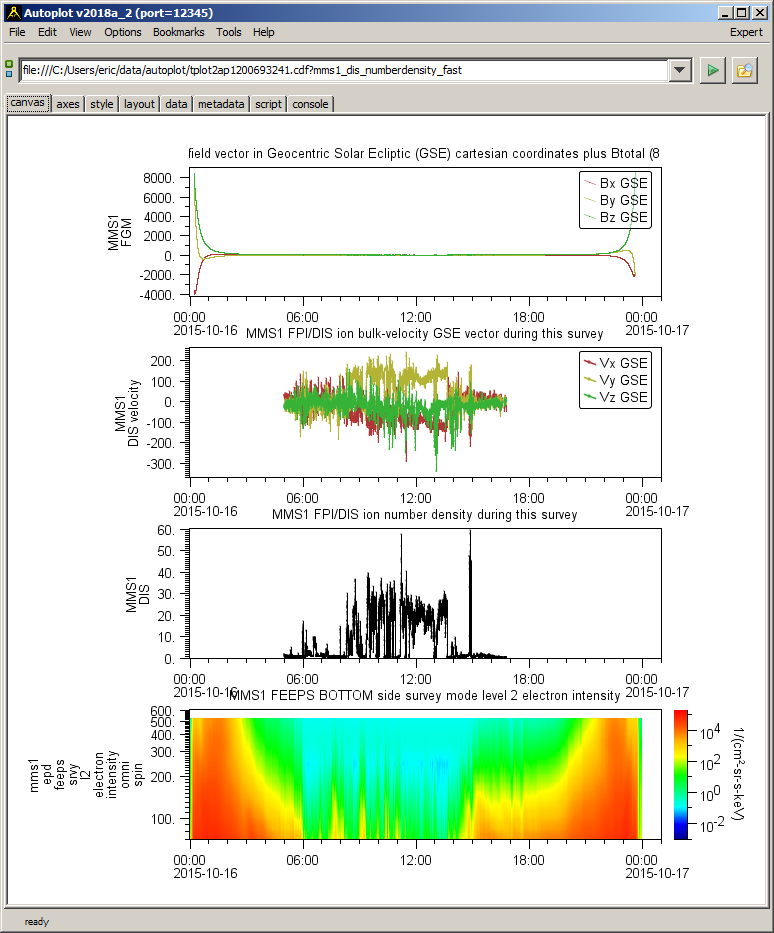
123 KB | Egrimes | 1 | |
| 23:18, 15 November 2018 | Main window graph area.png (file) |  |
124 KB | Nikos | Spedas 3.1 | 3 |
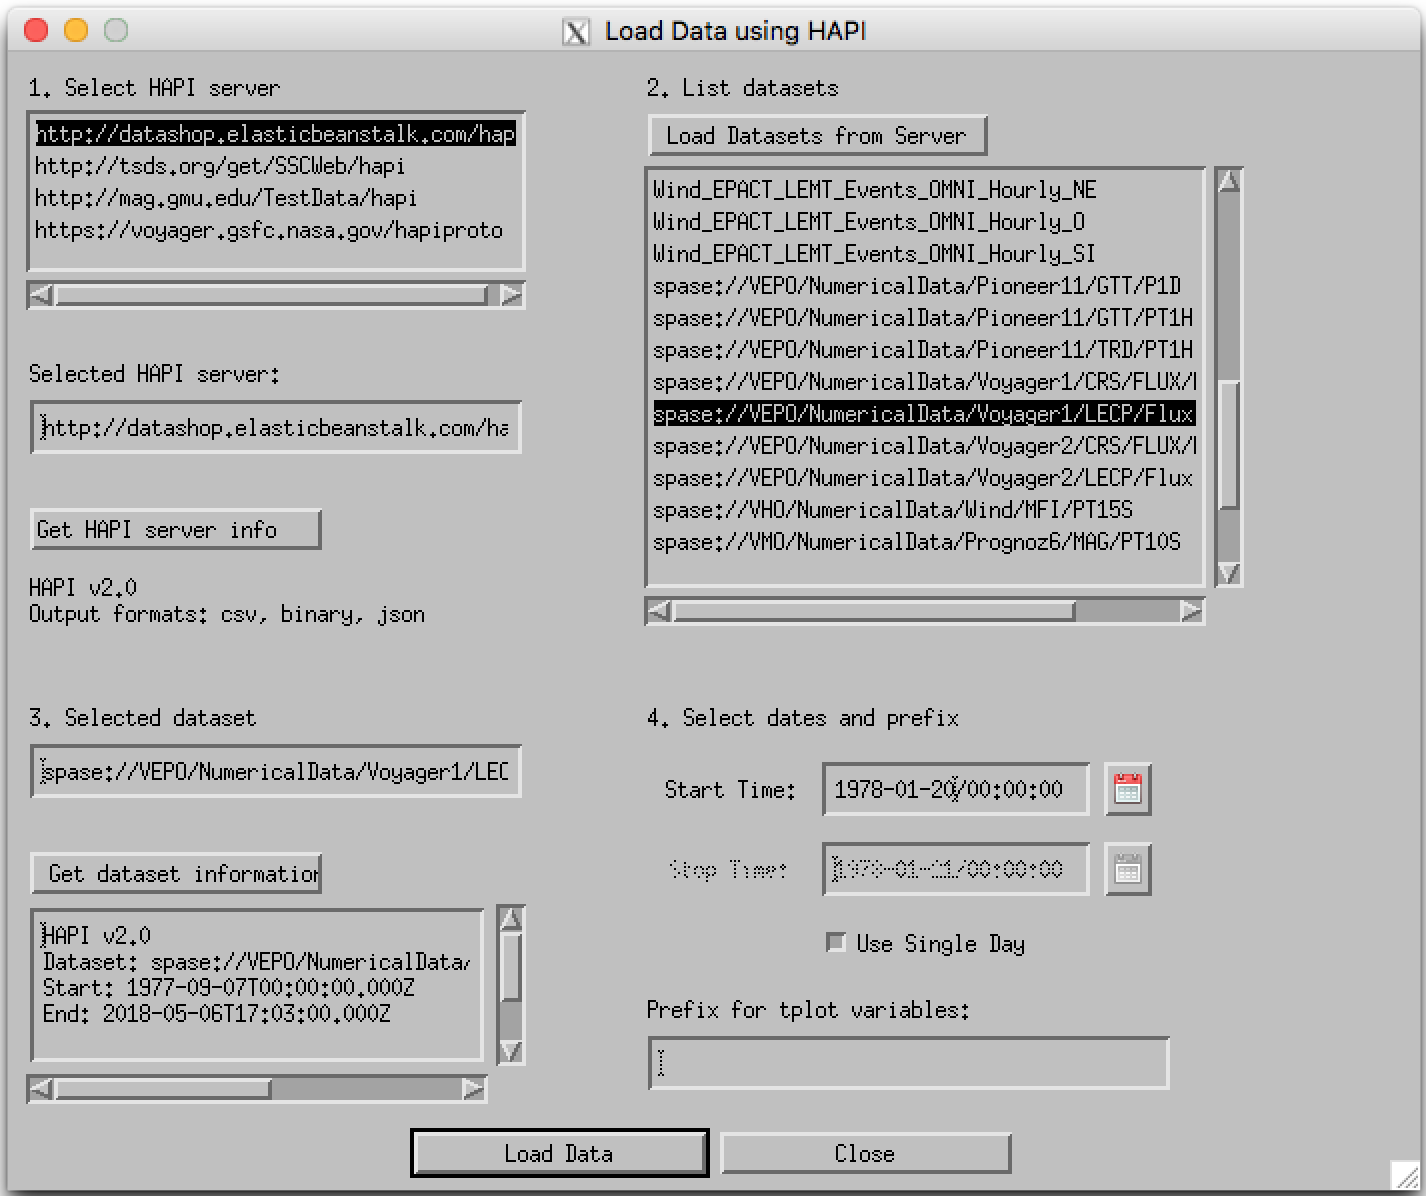
| 17:18, 21 May 2018 | Spedas gui hapi load.png (file) |  |
125 KB | Egrimes | 1 | |
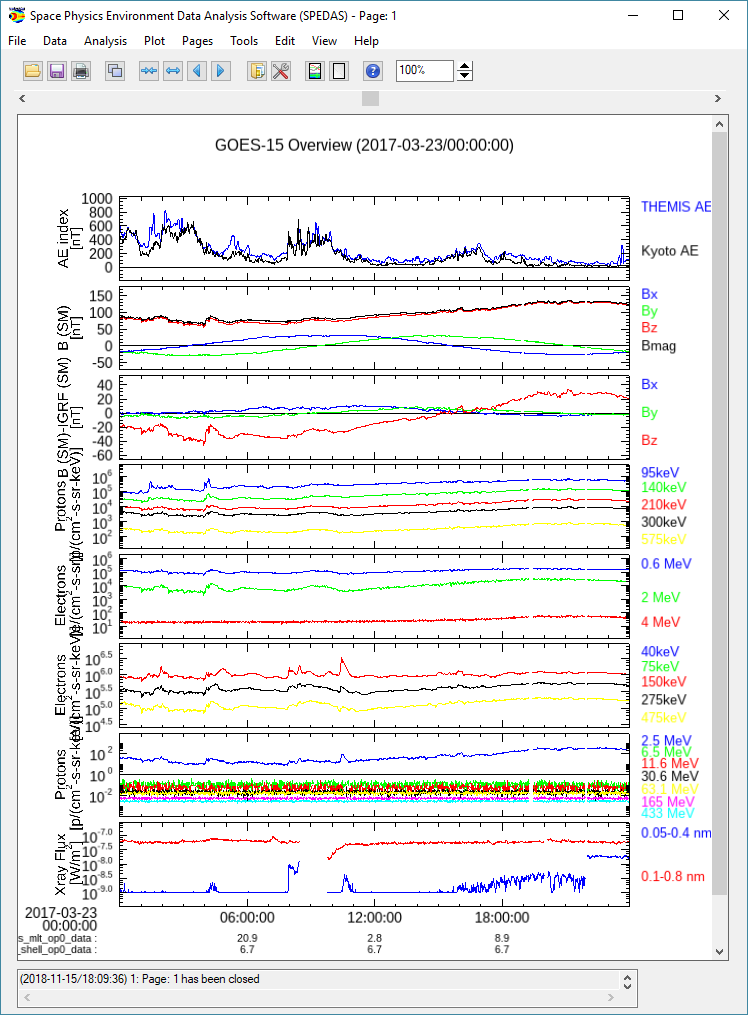
| 02:14, 16 November 2018 | Gui goes overview plot.png (file) |  |
126 KB | Nikos | Spedas 3.1 | 3 |
| 23:17, 19 August 2014 | Themis slice2d 3d bv example.png (file) |  |
134 KB | Floresaa | Basic example of a THEMIS particle distribution slice using ESA ion burst data. The x axis is parallel to the magnetic field, the y axis is defined such that the slice plane contains the bulk velocity vector (red). | 1 |
| 16:17, 27 May 2016 | Basic 2d slice.png (file) |  |
142 KB | Egrimes | 1 | |
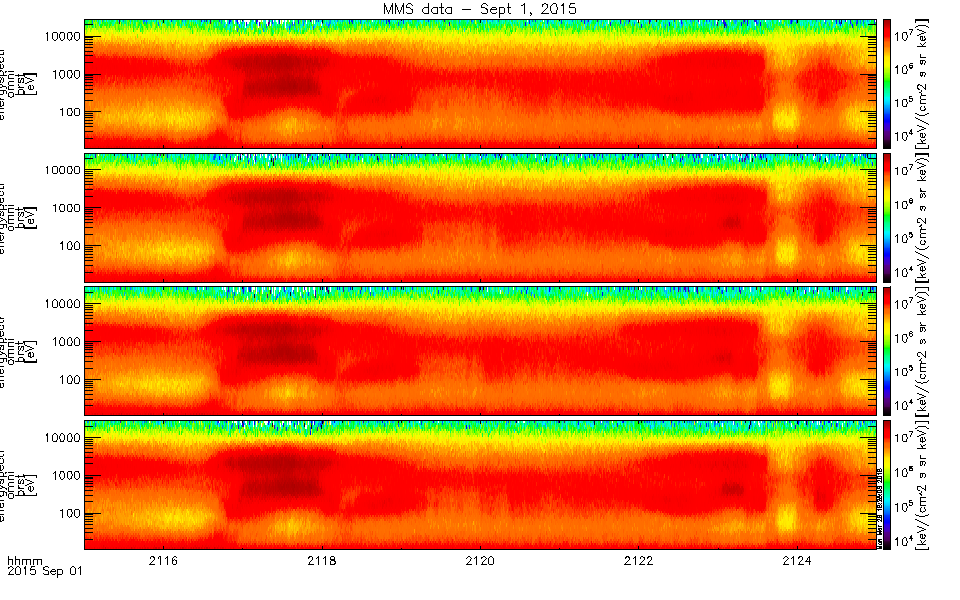
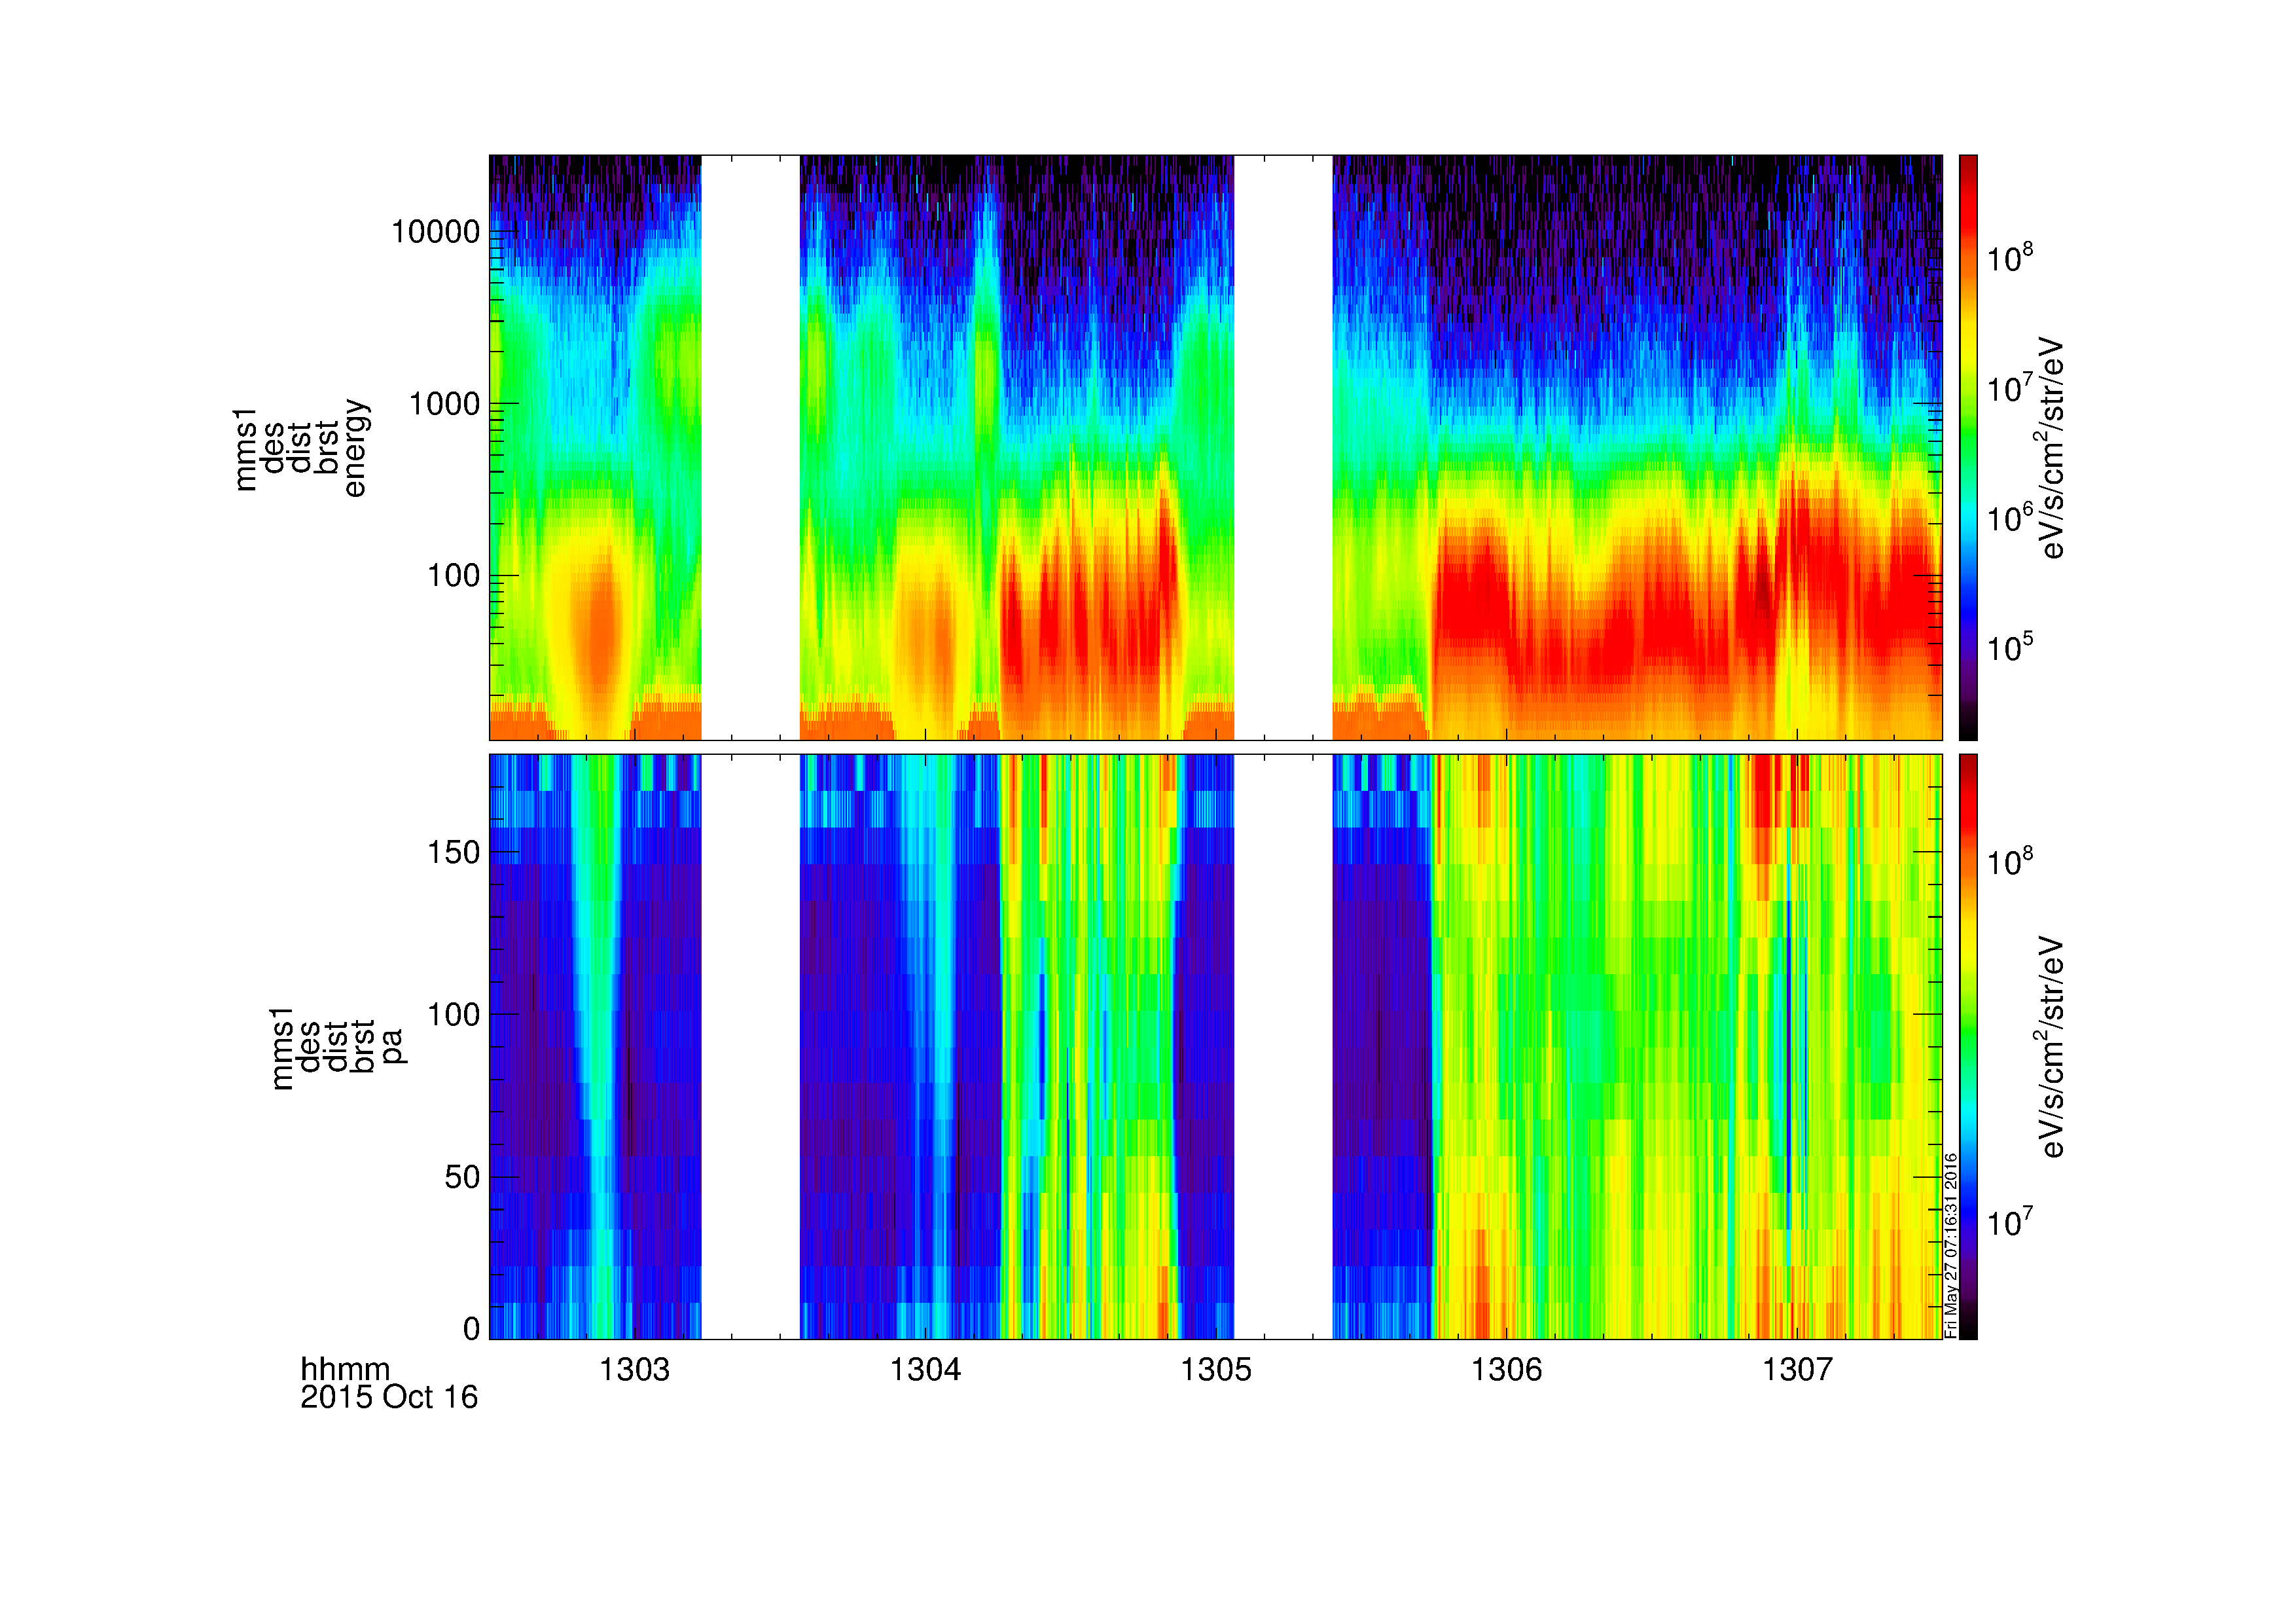
| 20:04, 24 May 2016 | EIS Electron Plots.png (file) |  |
155 KB | Clrussell | EIS Electron Energy Plot | 1 |
| 19:13, 5 February 2019 | 3.8.6.png (file) |  |
162 KB | Clrussell | 3 | |
| 00:00, 12 March 2016 | Stel3d mms fpi ion vol contours.PNG (file) |  |
167 KB | Floresaa | STEL3D tool displaying MMS FPI ion data. The plotted volume is data with V_z < 0. Contour lines are drawn along the x-z plane. | 1 |
| 00:35, 27 February 2016 | MMS Dayside Overview.png (file) |  |
181 KB | Floresaa | Basic dayside science overview plot created with mms_basic_dayside crib sheet. | 1 |
| 22:43, 26 October 2018 | Overview plot themis gui.png (file) |  |
187 KB | Nikos | Spedas 3.1 GUI | 2 |
| 22:03, 26 October 2018 | Spedas overview d.png (file) |  |
190 KB | Nikos | Spedas 3.1 GUI | 2 |
| 01:25, 27 March 2018 | Multiple plot test2.png (file) |  |
193 KB | Adrozdov | Screenshot of introductory example multiple_plot_test2 | 1 |
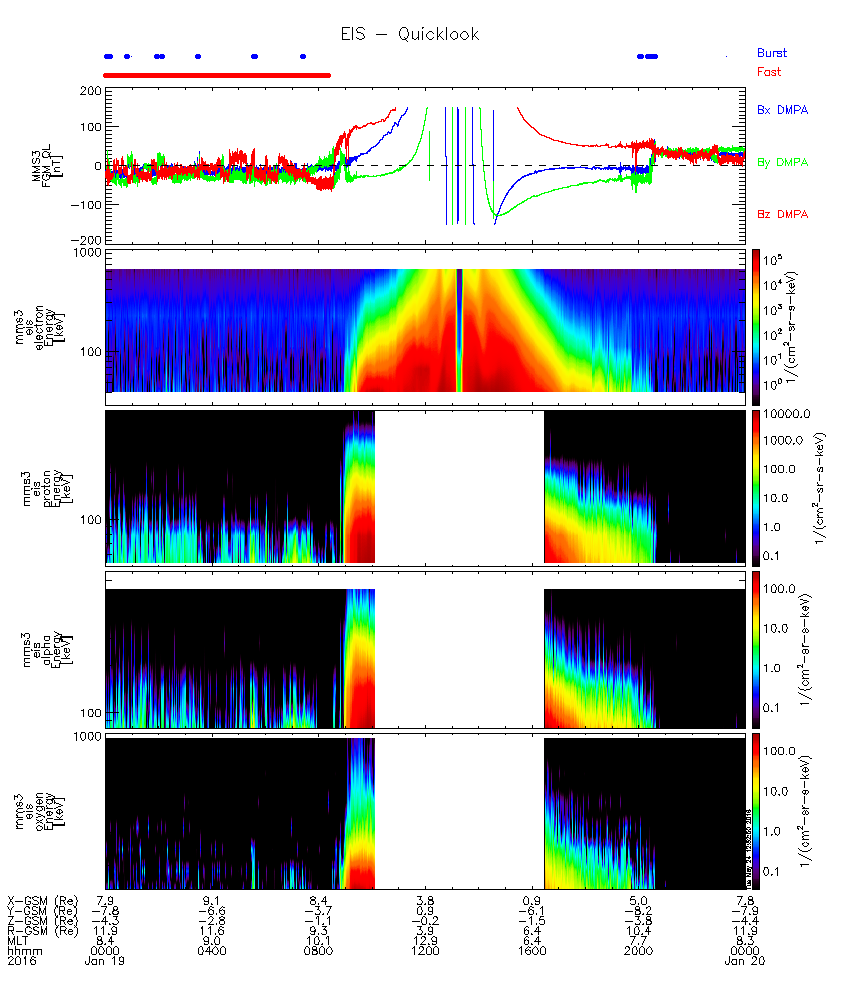
| 20:07, 24 May 2016 | EIS QuickLook Plots.png (file) |  |
196 KB | Clrussell | EIS QuickLook Plots | 2 |
| 17:50, 29 April 2016 | Fpi ion moms.png (file) |  |
196 KB | Egrimes | FPI ion data on March 7, 2016 | 1 |
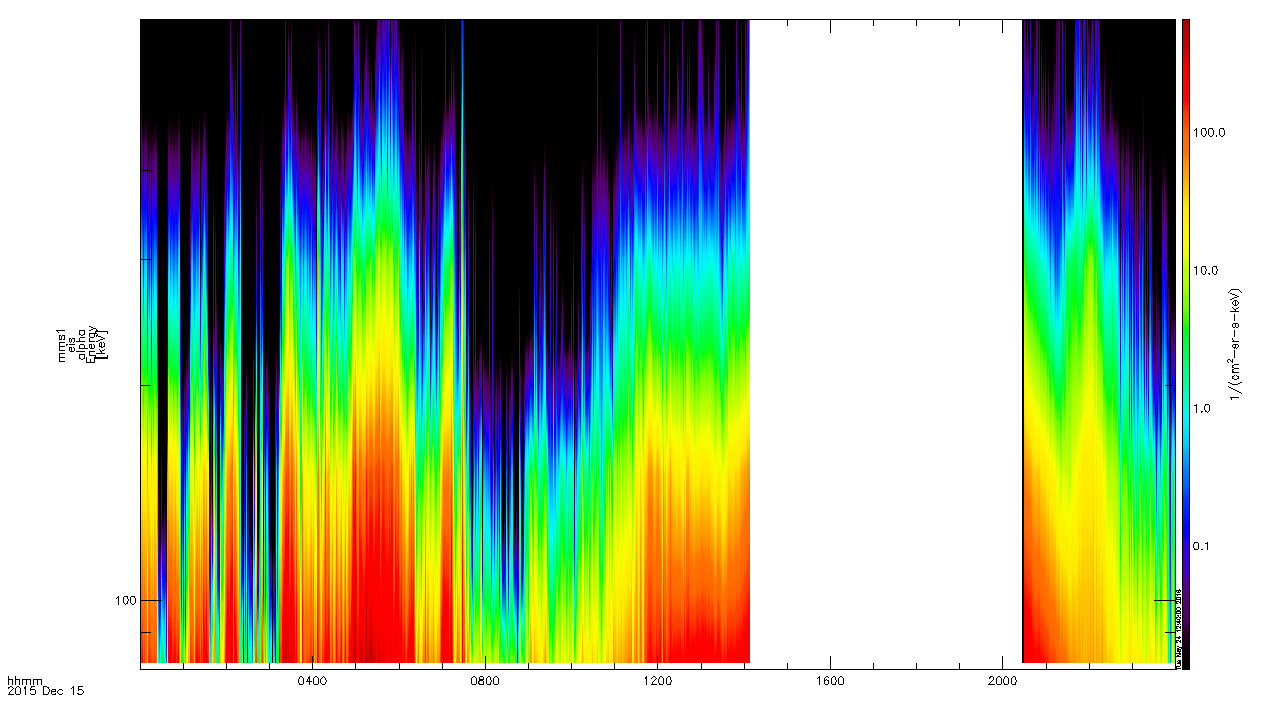
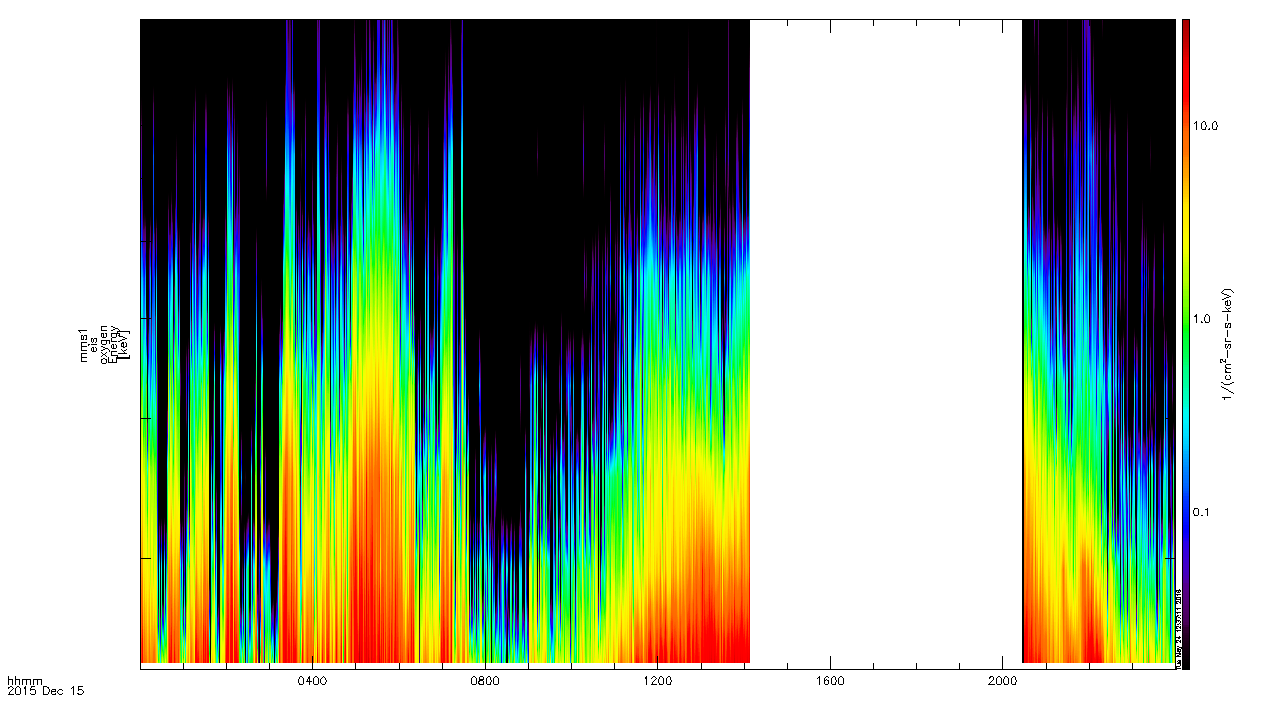
| 19:52, 24 May 2016 | EIS Hplus Plots.png (file) |  |
203 KB | Clrussell | EIS H+ Flux, all channels, December 15, 2015 | 1 |
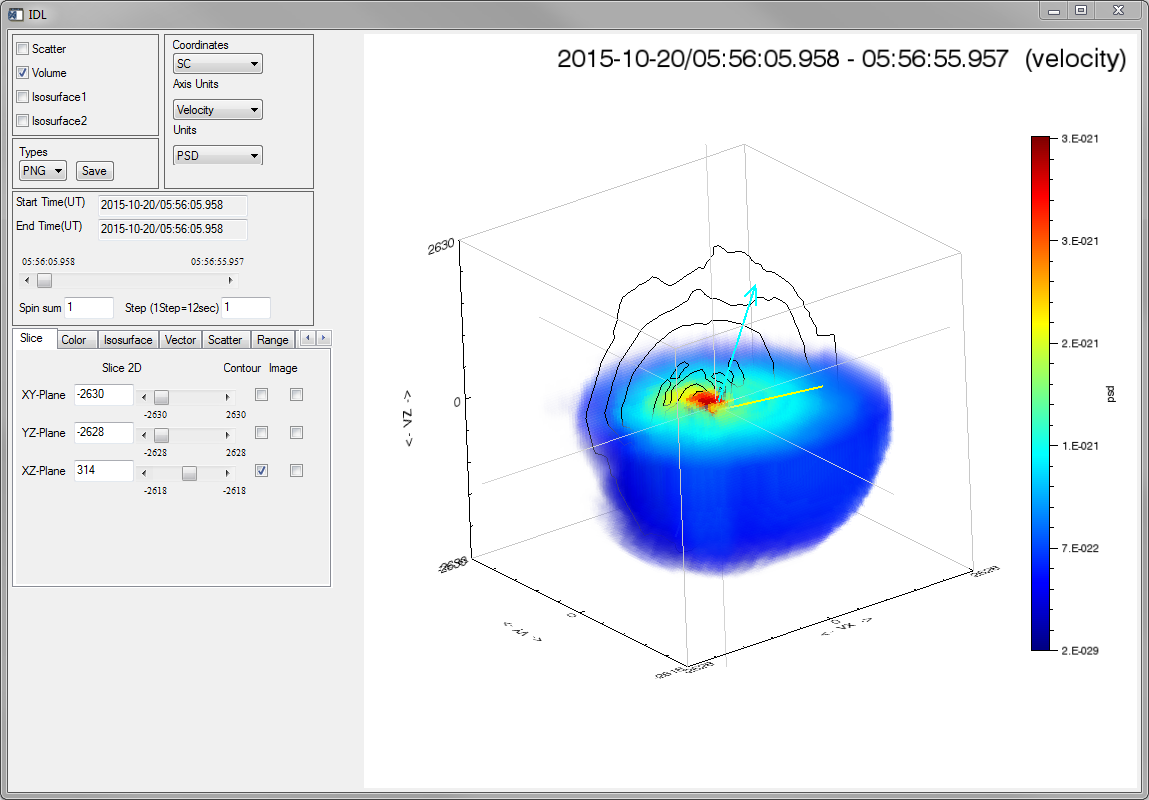
| 23:21, 27 May 2016 | Hpca isee 3d.PNG (file) |  |
204 KB | Floresaa | Visualization of 1 spin of HPCA H+ distribution using ISEE_3D. Image shows screenshot of GUI displaying voxel plot for V_z < 0 km/s (DBCS) and a line contour at y=314 km/s. ISEE_3D was developed by the Institute for Space-Earth Environmental Research... | 1 |
| 22:09, 23 May 2016 | FEEPS Quicklook Plot.png (file) |  |
216 KB | Clrussell | 2 | |
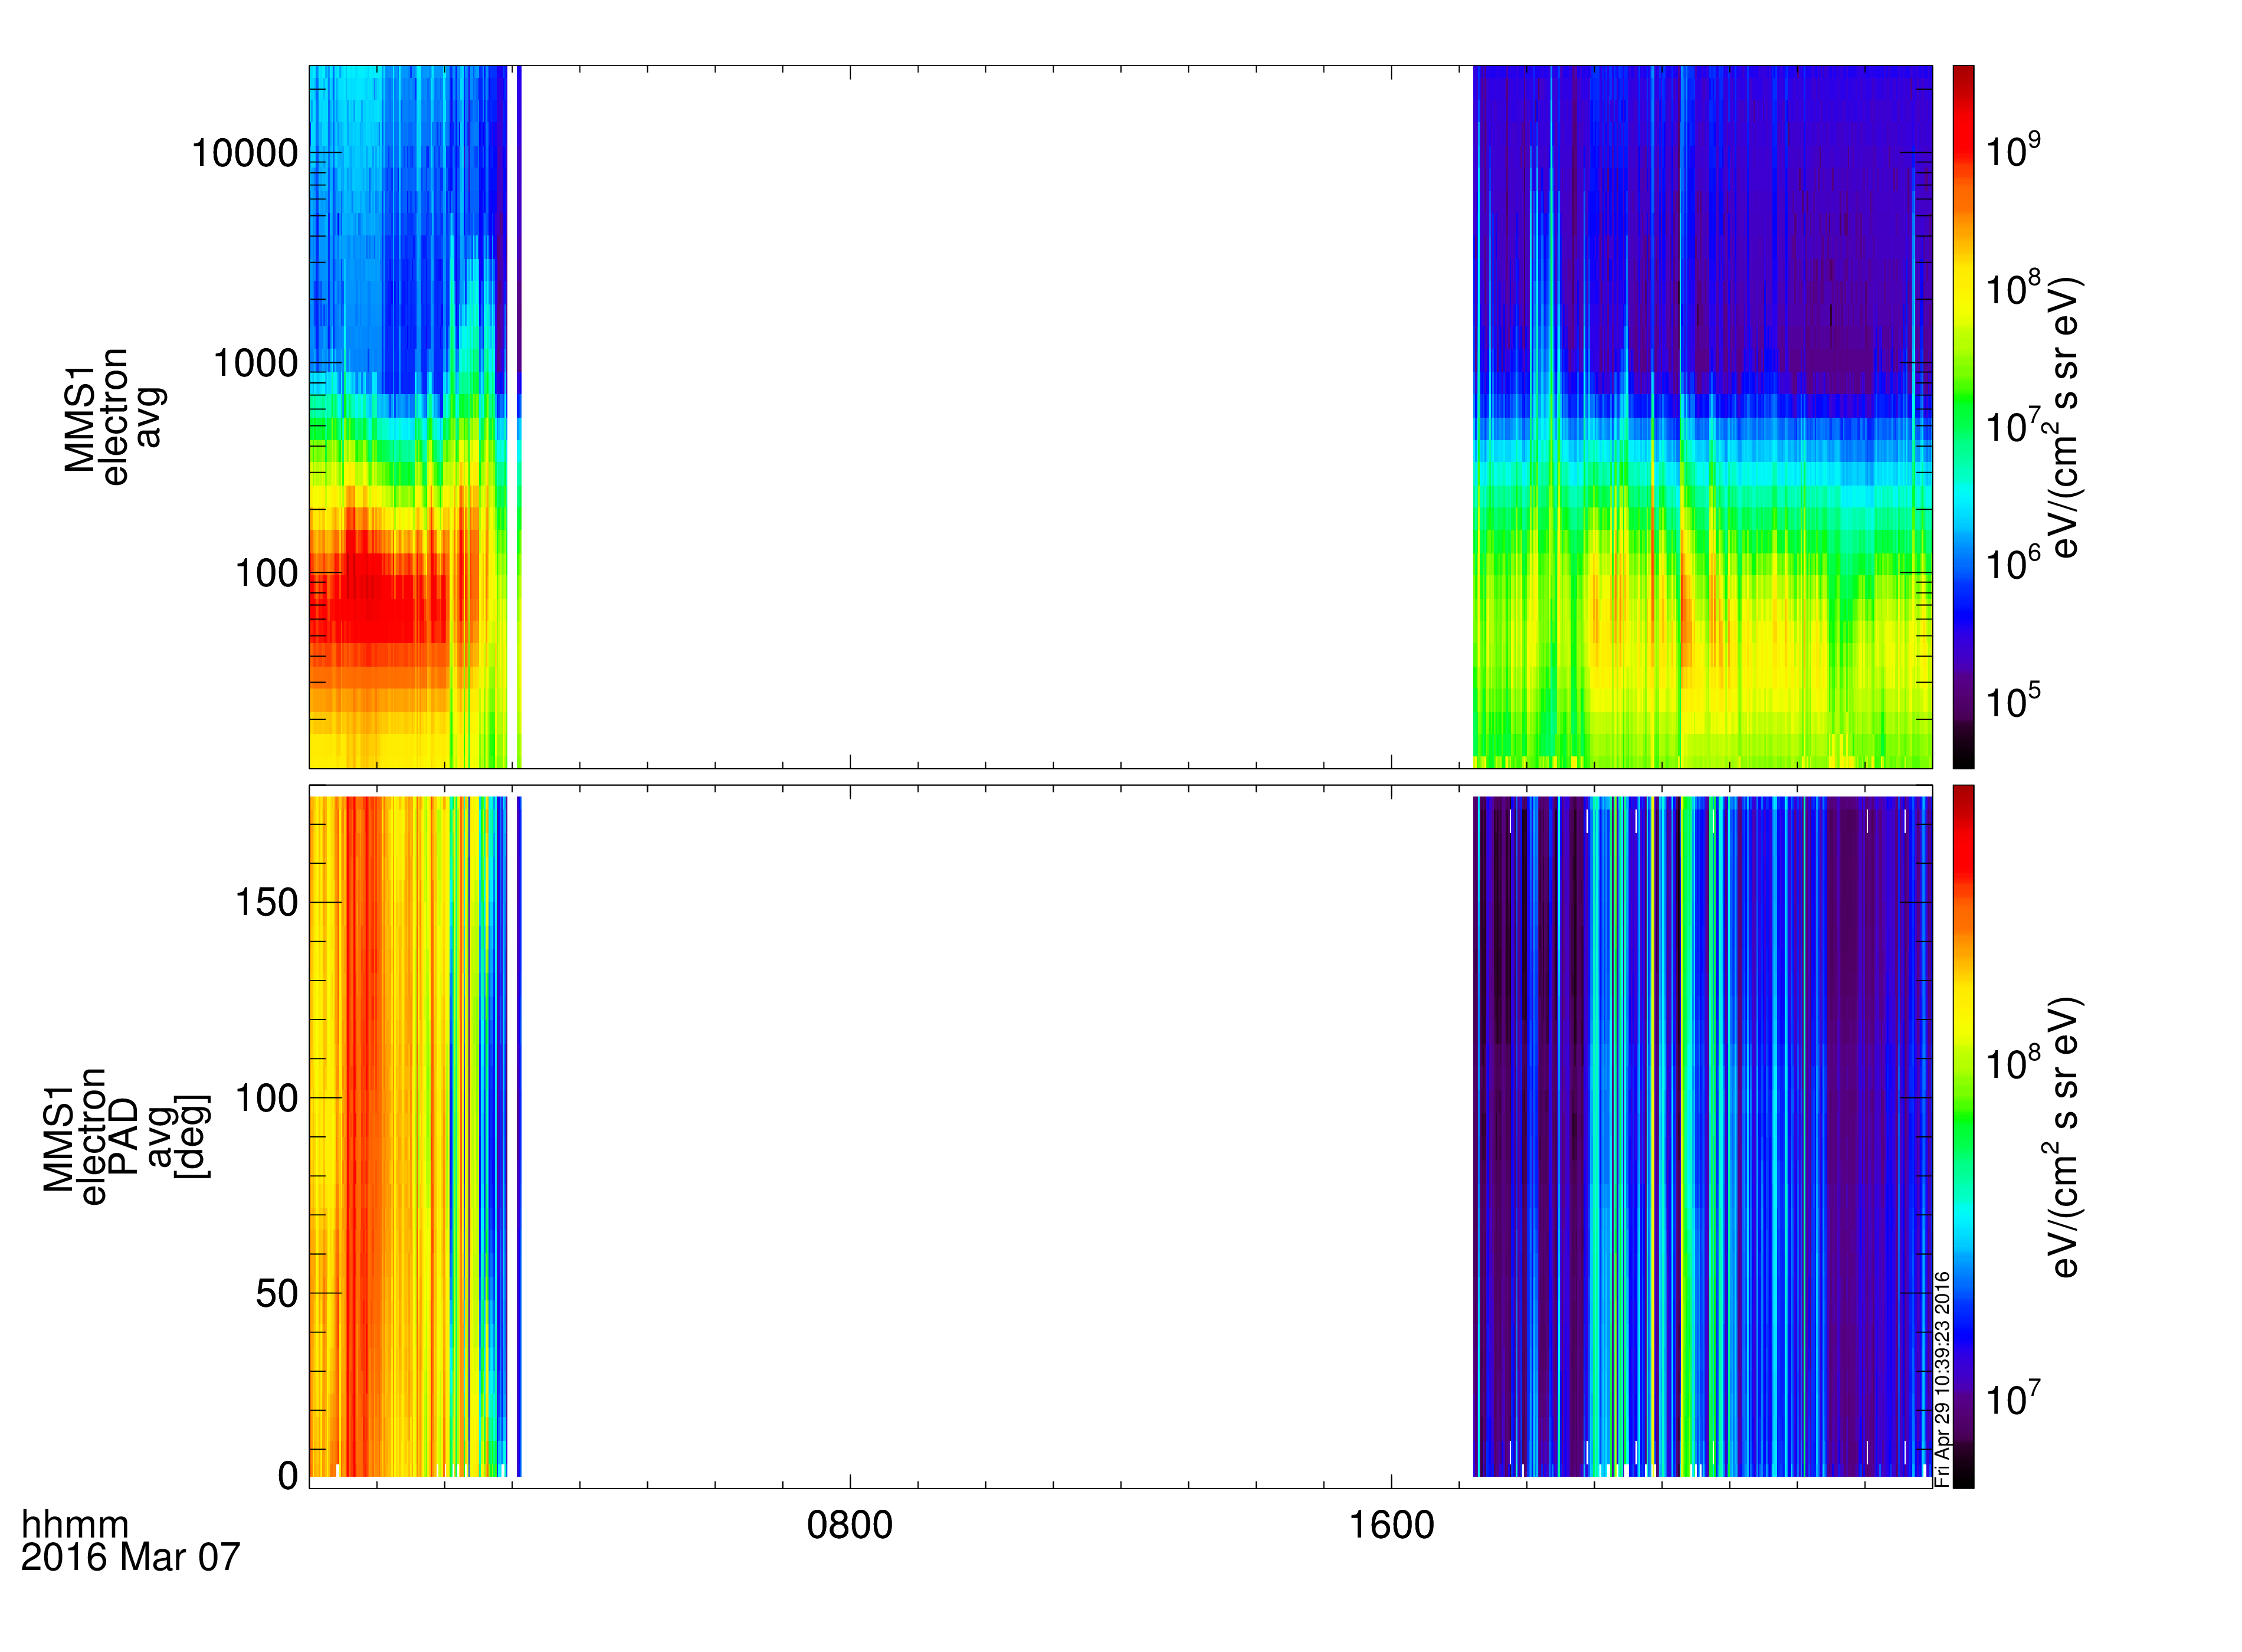
| 17:40, 29 April 2016 | Elec moms.png (file) |  |
219 KB | Egrimes | FPI electron energy spectra and pitch angle distribution on March 7, 2016 | 1 |
| 19:51, 24 May 2016 | EIS Heplusplus Plots.png (file) |  |
241 KB | Clrussell | EIS He++ Flux, all channels, December 15, 2015 | 1 |
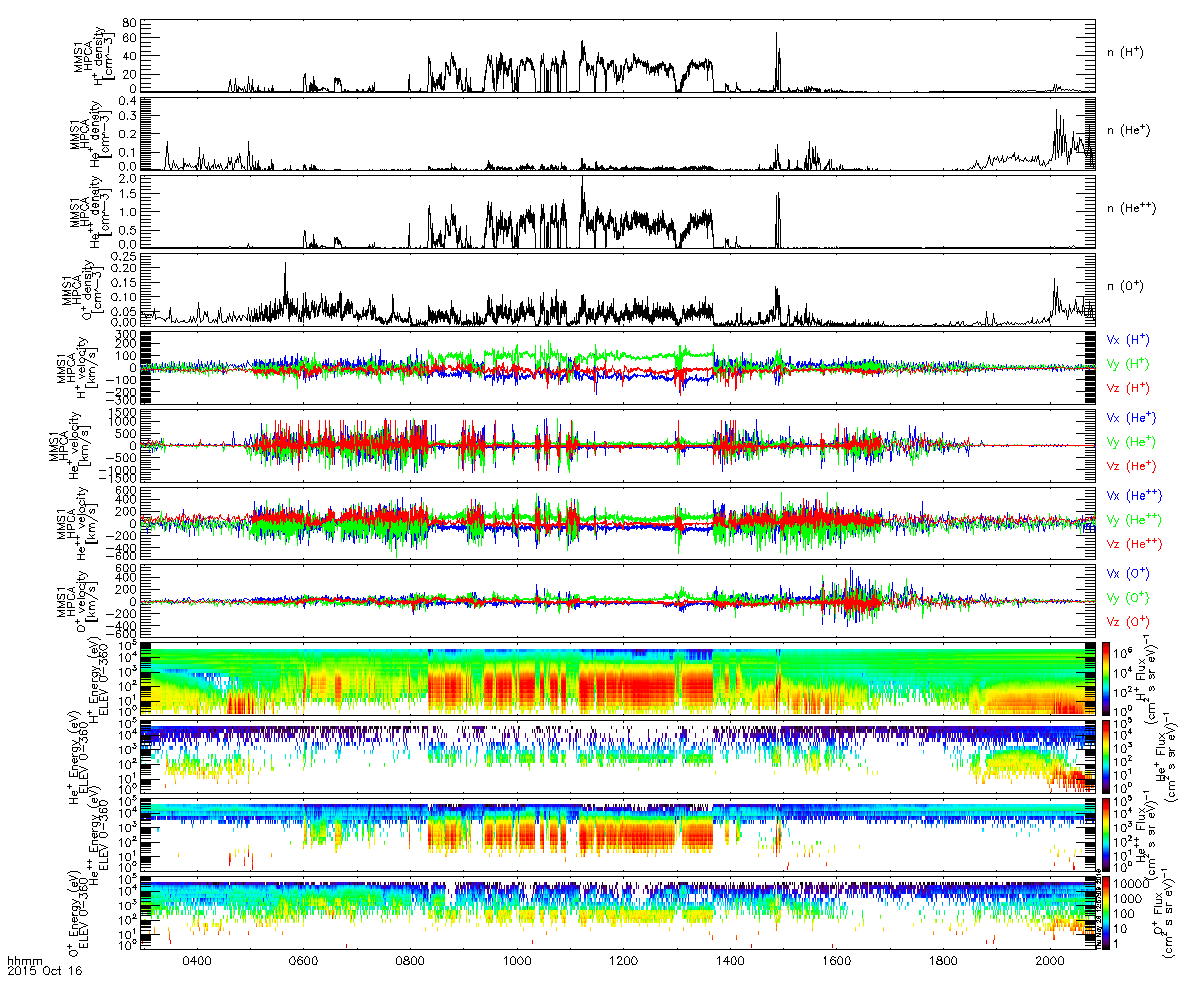
| 22:54, 27 May 2016 | Hpca overview.png (file) |  |
243 KB | Floresaa | Overview of HPCA moments and spectra available from mms_load_hpca. | 1 |
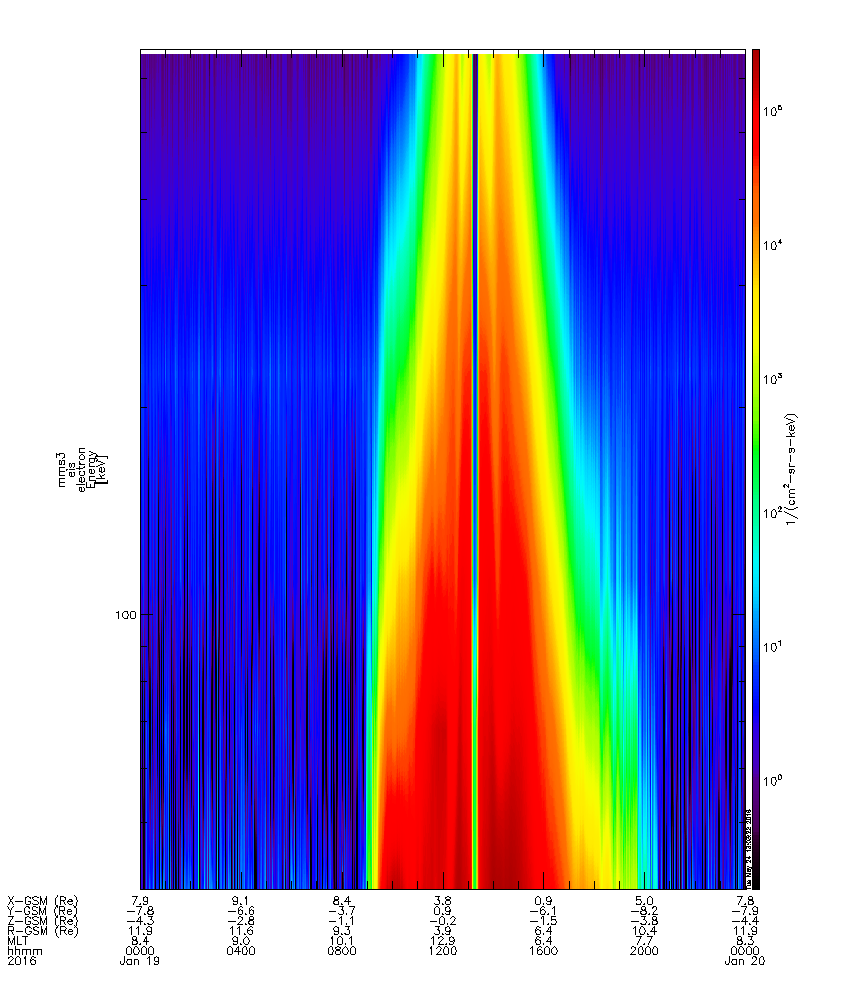
| 15:03, 27 May 2016 | Mms part products ion spec.png (file) |  |
246 KB | Egrimes | 1 | |
| 19:52, 24 May 2016 | EIS Oplus Plots.png (file) |  |
246 KB | Clrussell | EIS O+ Flux, all channels, December 15, 2015 | 1 |
| 14:28, 27 May 2016 | Mms part products fpi spec.png (file) |  |
256 KB | Egrimes | 1 | |
| 21:31, 20 August 2014 | Thm slice smooth.png (file) |  |
313 KB | Floresaa | Distribution slice of ESA ion burst data using 3D interpolation. Left plot has no smoothing, right plot has default 7 pt smoothing window applied (both use default 150pt plot resolution). | 1 |
| 22:13, 26 May 2016 | Mms4 scm dpwrspc.png (file) |  |
359 KB | Egrimes | 1 | |
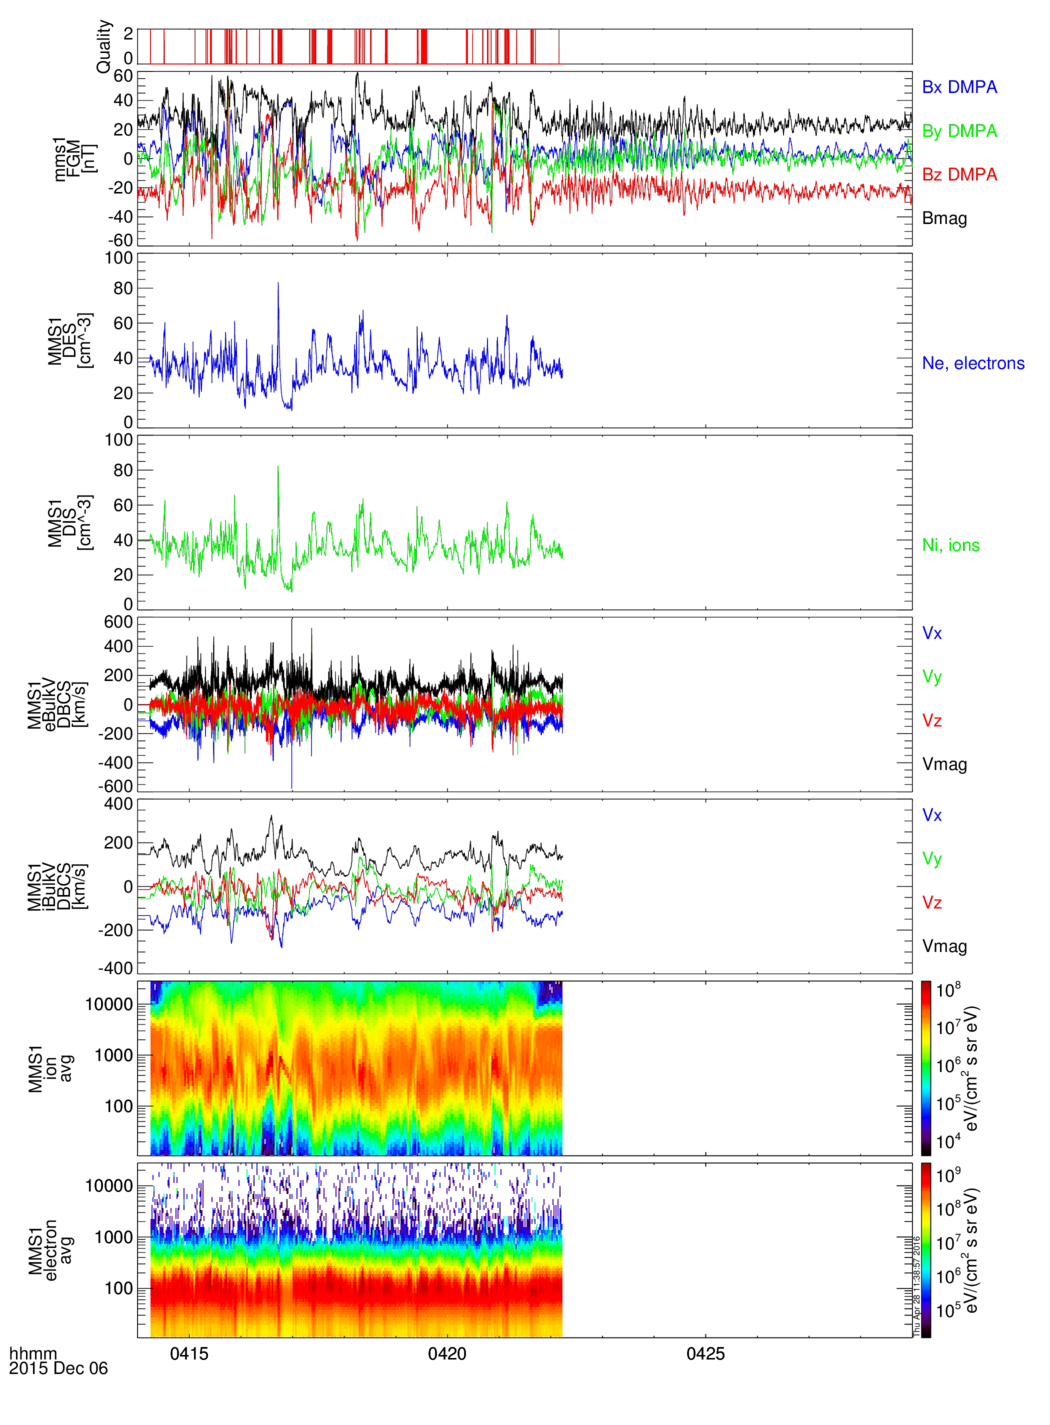
| 18:53, 28 April 2016 | Fpi summary plot2.png (file) |  |
639 KB | Egrimes | FPI summary plot for MMS1 | 1 |
| 17:09, 29 April 2016 | SPEDAS Developers Workshop GEM December 2015.pptx (file) | 1.84 MB | Nikos | SPEDAS Developers Workshop GE December 2015 | 1 | |
| 17:16, 29 April 2016 | MMS intro for SPEDAS tutorial.pptx (file) | 8.45 MB | Nikos | MMS introduction for SPEDAS tutorial, 2015 | 1 |